Drag Racer
This is the winning entry to our Drag Racer competition by UofG psychology student Ellie Brownlie.
Intro
See final section, Beauty fades, data vis is forever! (Summary), for full summary.
Background: RuPaul’s Drag Race is a hit American TV show featuring Drag Queen contestants competing against one another in a variety of challanges to become America’s ‘next drag superstar’. Some have hypothesied that Bianca Del Rio, a constestant featured in the 6th season of RuPaul’s Drag Race, was the greatest contestant of all time but little analysis of data has invesitgated this.
Methods: Data collected within the RStudio package ‘DragRaceR’ categorises each individual contestant’s episode outcome. Outcome data was transformed into heirarchical, numerical outcome scores ranging from 0 to 10, awarded for each contestant’s episode outcomes. Outcome scores were then divided by the number of episodes each contestant appeared in to produce a ‘weighted outcome score’ in order to account for differing numbers of episode per season and individual queens returning for multiple seasons.
Results: Data visualisations were produced from the running weighted outcome scores of each contestant. Comparison of final, cumulative, weighted outcome scores show that Bianca Del Rio achieved the highest score on this measure, even after accounting for the number of episodes she appeared in. She was closely followed by Bob the Drag Queen but was well above the average of other queens.
Conclusion: Bianca Del Rio is the best drag race contestant of all time when cumulative weighted outcome scores of RuPaul’s Drag Race contestants are compared.
Werk
Reading in is fundemental
# Package names
packages <- c("dragracer", "tidyverse", "plotly", "pacman", "grid", "ggimage", "showtext", "knitr")

#Package Uses
###"dragracer" = data package
###"tidyverse" = data wrangling
###"plotly" = plot interactivity
###"pacman" = plot picture background
###"grid" =  plot picture background
###"ggimage" =  plot picture geom_point
###"showtext" = plot fonts
###"knitr" = make pretty markdown tables

# Install packages not yet installed (will not re-install packages that are already installed)
#installed_packages <- packages %in% rownames(installed.packages())
#if (any(installed_packages == FALSE)) {
#  install.packages(packages[!installed_packages])
#}

# Packages loading
invisible(lapply(packages, library, character.only = TRUE))
head(rpdr_contep) ## # A tibble: 6 x 11
## season rank missc contestant episode outcome eliminated participant minichalw
## <chr> <dbl> <chr> <chr> <dbl> <chr> <chr> <chr> <chr>
## 1 S01 1 0 BeBe Zaha~ 1 SAFE 0 1 0
## 2 S01 2 1 Nina Flow~ 1 WIN 0 1 0
## 3 S01 3 0 Rebecca G~ 1 LOW 0 1 0
## 4 S01 4 0 Shannel 1 SAFE 0 1 0
## 5 S01 5 0 Ongina 1 HIGH 0 1 0
## 6 S01 6 0 Jade 1 SAFE 0 1 0
## # ... with 2 more variables: finale <dbl>, penultimate <dbl>Data Wrangling is not a contact sport
Eliminate incomplete data points:
rpdr_contep <- na.omit(rpdr_contep) outcomes <- rpdr_contep %>%
group_by(outcome) %>%
count()Create dummy variable assigning points to each contestant based on the outcome of each episode:
| Outcome | Coded Criteria | Points Assigned |
|---|---|---|
| Overall Win (final episode) | finale == 1 & outcome == "WIN" |
10 |
| Overall Miss Congenitality (final episode) | finale == 1 & missc == 1, outcome == "MISSCON" |
8 |
| Main Challange Win | outcome == "WIN" |
6 |
| Mini Challange Win | minichalw == 1 |
5 |
| Top | outcome == "HIGH" |
4 |
| Safe, or Safe and Deptarted | outcome == "SAFE", outcome == "SAFE + DEPT" |
3 |
| Bottom (Non LipSync) | outcome == "LOW" |
2 |
| Shantied | outcome == "BTM" & eliminated == 0" |
1 |
| Eliminated, lost first round of finale lip syncs or did not appear or ‘RUNNING’ (effectively NA) | outcome == "BTM" & eliminated == 1, outcome == "LOST2ND ROUND", outcome == "LOST1ST ROUND", outcome == "RUNNING" |
0 |
| Returned (but did not contest) or Running (effectively NA) | outcome == "RTRN", outcome == "RUNNING" |
filtered out |
points_rpdr_contep <- rpdr_contep %>%
  mutate(ep_point = case_when(
  (finale == 1 & outcome == "WIN") ~ 10, #Overall Win
  (finale == 1 & missc == 1) ~ 8, #Overall Miss Congenitality
  (outcome == "MISSCON") ~ 8, #Overall Miss Congenitality
  (outcome == "WIN") ~ 6, #Main Challange Win
  (outcome == "WIN+RTRN") ~ 6, #Main Challange Win
  (minichalw == 1) ~ 5, #Mini Challange Win
   (outcome == "LOST3RD ROUND") ~ 5, #Won first round of finale lip syncs (lost 2nd)
  (outcome == "HIGH") ~ 4, #Top
  (outcome == "TOP2") ~ 4, #Top
  (outcome == "SAFE") ~ 3, #Safe
  (outcome == "SAFE+DEPT") ~ 3, #Safe
  (outcome == "LOW") ~ 2, #Bottom
  (outcome == "BTM" & eliminated == 0) ~ 1, #Shantied
  (outcome == "BTM" & eliminated == 1) ~ 0, #Eliminated
  (outcome == "OUT") ~ 0, #Eliminated
  (outcome == "LOST2ND ROUND") ~ 0, #Lost first round of finale lip syncs
  (outcome == "LOST1ST ROUND") ~ 0), #Lost first round of finale lip syncs
  .after = outcome) %>%
  filter(outcome != "RTRN")  %>% #Returned (but did not contest)
  filter(outcome != "RUNNING") #Running, (effectively NA)
Create count of episodes per season, add column with n of episodes per season to points_rpdr_contep
season_ep_count <- group_by(points_rpdr_contep, season, episode) %>%
  summarise() %>%
  count() %>%
  ungroup() %>%
  rename(n_season_ep = n)

points_rpdr_contep <- inner_join(points_rpdr_contep, season_ep_count, .after = season) %>%
  select(season, n_season_ep, everything())
Create count of episodes per contestant, add column with n of episodes per contestent to points_rpdr_contep
contest_ep_count <- points_rpdr_contep %>%
  group_by(contestant) %>%
  summarise(n = n()) %>%
  ungroup() %>%
  rename(n_contest_ep = n)

points_rpdr_contep <-
  inner_join(points_rpdr_contep, contest_ep_count, by = "contestant") %>%
  select(contestant, n_contest_ep, everything())
Compare, for each contestant, whether the number of episodes that they appeared in is more than the number of episodes in the season they appeared in.
- Possible for some contestants as some returned, but should not be more than the number of episodes within a season.
compare <- points_rpdr_contep %>%
  select(contestant, n_season_ep,  n_contest_ep) %>%
  group_by(contestant, n_season_ep,  n_contest_ep) %>%
  summarise() %>%
  mutate(compare = (n_season_ep < n_contest_ep)) %>%
  ungroup()

compare %>%
  group_by(compare) %>%
  count() %>%
  ungroup()
## # A tibble: 2 x 2
## compare n
## <lgl> <int>
## 1 FALSE 152
## 2 TRUE 3compare_constestants <- compare %>%
filter(compare == TRUE)
compare_constestants## # A tibble: 3 x 4
## contestant n_season_ep n_contest_ep compare
## <chr> <int> <int> <lgl>
## 1 Eureka O'Hara 12 17 TRUE
## 2 Shangela 10 11 TRUE
## 3 Vanessa Vanjie Mateo 12 13 TRUE- No contestant appeared in more episodes than the number of episodes within a season.
Create dummy variable weighting the points assigned to each to contestant outcome by the number of episodes they appear in:
points_rpdr_contep <- points_rpdr_contep %>%
  mutate(w_ep_point = (ep_point/n_contest_ep), .after = ep_point)
Create table with each contestants total weighted points, arrange in desending order
scores <- points_rpdr_contep %>%
  group_by(contestant) %>%
  summarise(total_score = sum(w_ep_point)) %>%
  arrange(desc(total_score))

scores
## # A tibble: 152 x 2
## contestant total_score
## <chr> <dbl>
## 1 Bianca Del Rio 4.92
## 2 Bob the Drag Queen 4.90
## 3 BeBe Zahara Benet 4.71
## 4 Tyra Sanchez 4.7
## 5 Nina Flowers 4.57
## 6 Jinkx Monsoon 4.5
## 7 Sasha Velour 4.5
## 8 Sharon Needles 4.5
## 9 Violet Chachki 4.46
## 10 Raja 4.38
## # ... with 142 more rowsCreate Varible running_total
data_clean_new <- points_rpdr_contep %>%
  group_by(contestant) %>%
  mutate(running_total = 0, running_total = cumsum(w_ep_point)) %>%
  arrange(contestant, episode)
Isolate Bianca Del Rio’s Data and create new tibble bianca
bianca <- filter(data_clean_new, contestant == "Bianca Del Rio") %>%
  mutate(image = "bianca_head.png")
Create new tibble means, containing mean running total per episode
means <- data_clean_new %>%
  group_by(episode) %>%
  summarise(running_total = mean(running_total)) %>%
  mutate(contestant = "Mean Average") %>%
  mutate(image = "star_point.png")
Create sample tables
set.seed(96) #seed 96

top_5 <- scores %>%
  slice_head(n = 5)

mean_cummulative_score <- scores %>%
  summarise(total_score = mean(total_score)) %>%
  mutate(contestant = "Mean Average")

top_10 <- scores %>%
  slice_head(n = 10) %>%
  bind_rows(mean_cummulative_score)


random_sample <- slice_sample(scores, n = 5)

top5_plus_random <- bind_rows(top_5, random_sample) %>%
  arrange(desc(total_score))

data_clean_reduced <- filter(points_rpdr_contep,
                     (contestant %in%
                      top5_plus_random$contestant)) %>%
  ungroup() %>%
  group_by(contestant) %>%
  mutate(running_total = 0, running_total = cumsum(w_ep_point)) %>%
  arrange(contestant, episode) %>%
  bind_rows(means)
Plot for the Gawds
top5_and_sample_plot
top5_and_sample_plot <- ggplot(data_clean_reduced, aes(x = episode,
                           y = running_total,
                           group = contestant,
                           color = contestant)) +
  geom_line() +
  geom_point() +
  theme_bw()  +
  scale_x_continuous(breaks = seq(0,15, by=1)) +
  scale_color_discrete("") +
   theme(text = element_text(face = "bold")) +
  labs(x= "Episode",
       y= "Running Outcome Score (Weighted)",
       title= "Bianca Del Rio Is the Best Drag Race Contestant Of All Time")+
  theme(plot.background = element_rect(fill = '#EA259A'),
        panel.grid.major = element_line(colour = "grey", size=0.5),
        panel.grid.minor = element_line(colour = "grey"),
        plot.title = element_text(hjust = -.1),
        text = element_text(family = "", colour = "white"),
        axis.title.x = element_text(size = 12, face = "bold"),
        axis.title.y = element_text(size = 12, face = "bold"),
        axis.text = element_text(colour = "white"),
        title = element_text(size = 14, face = "bold"),
        legend.text = element_text(colour = "black")) +
  scale_x_continuous(breaks = seq(0,15, by=1)) +
  labs(x= "Episode",
       y= "Running Outcome Score (Weighted)",
       title= "Bianca Del Rio Is the Best Drag Race Contestant Of All Time")
main_plot
Load in Image For Backgroud
image <- png::readPNG("werk_background.png")Load in Fonts
myfont <- "Londrina Solid"
font_add_google(myfont, myfont)
showtext_auto()
Create main_plot
main_plot <- ggplot(data_clean_new, aes(x = episode, y = running_total,  group = contestant)) +
  annotation_custom(rasterGrob(image,
                               width = unit(1,"npc"),
                               height = unit(1,"npc")),
                               -Inf, Inf, -Inf, Inf) +
  geom_point(alpha = 0.5, colour = "white") +
  geom_point(data = means, position = position_dodge(width = 0.9), colour = "yellow", shape = 19, size = 4, aes(x = episode, y = running_total)) +
  geom_line(data = means, position = position_dodge(width = 0.9), colour = "yellow", shape = 19, size = 1, aes(x = episode, y = running_total)) +
  geom_point(data = bianca, position = position_dodge(width = 0.9), colour = "black", shape = "star", size = 4, aes(x = episode, y = running_total)) +
  geom_line(data = bianca, position = position_dodge(width = 0.9), colour = "black", shape = 19, size = 1, aes(x = episode, y = running_total)) +
  theme(panel.background = element_rect(fill = '#CB1883'),
        plot.background = element_rect(fill = '#D31988'),
        panel.grid.major = element_line(colour = "grey", size=0.5),
        panel.grid.minor = element_line(colour = "grey"),
        plot.title = element_text(hjust = 0.5),
        text = element_text(family = myfont, colour = "white"),
        axis.title.x = element_text(size = 20, face = "bold"),
        axis.title.y = element_text(size = 20, face = "bold"),
        axis.text = element_text(colour = "white"),
        title = element_text(size = 24, face = "bold")) +
  geom_image(data = means, aes(image = image), size=.075) +
  geom_image(data = bianca, aes(image = image), size=.075) +
  scale_x_continuous(breaks = seq(0,15, by=1)) +
  labs(x= "Episode",
       y= "Running Outcome Score (Weighted)",
       title= "Bianca Del Rio Is the Best Drag Race Contestant Of All Time")
Create interactive_main_plot
interactive_main_plot <- ggplot(data_clean_new, aes(x = episode, y = running_total, group = contestant)) +
  annotation_custom(rasterGrob(image,
                               width = unit(1,"npc"),
                               height = unit(1,"npc")),
                               -Inf, Inf, -Inf, Inf) +
  geom_point(alpha = 0.5, colour = "white") +
  geom_point(data = means, position = position_dodge(width = 0.9), colour = "yellow", shape = "star", size = 4, aes(x = episode, y = running_total)) +
  geom_line(data = means, position = position_dodge(width = 0.9), colour = "yellow", shape = 19, size = 1, aes(x = episode, y = running_total)) +
  geom_point(data = bianca, position = position_dodge(width = 0.9), colour = "blue", shape = "star", size = 4, aes(x = episode, y = running_total)) +
  geom_line(data = bianca, position = position_dodge(width = 0.9), colour = "blue", shape = 19, size = 1, aes(x = episode, y = running_total)) +
  theme(panel.background = element_rect(fill = '#EA259A'),
        plot.background = element_rect(fill = '#D31988'),
        panel.grid.major = element_line(colour = "grey", size=0.5),
        panel.grid.minor = element_line(colour = "grey"),
        plot.title = element_text(hjust = 0.5),
        text = element_text(family = "", colour = "white"),
        axis.title.x = element_text(size = 14, face = "bold"),
        axis.title.y = element_text(size = 14, face = "bold"),
        axis.text = element_text(colour = "white"),
        title = element_text(size = 16, face = "bold")) +
  scale_x_continuous(breaks = seq(0,15, by=1)) +
  labs(x= "Episode",
       y= "Running Outcome Score (Weighted)",
       title= "Bianca Del Rio Is the Best Drag Race Contestant Of All Time")
Beauty fades, data vis is forever! (Summary)
Background
- RuPaul’s Drag Race is a hit American TV show featuring Drag Queen contestants competeing against one another in a variety of challanges to become America’s ‘next drag superstar’. Some have hypothesied that Bianca Del Rio, a constestant featured in the 6th season of RuPaul’s Drag Race, was the greatest contestant of all time but little analysis of data has invesitgated this.
Methods
Data collected within the RStudio package ‘DragRaceR’ categorises each individual contestant’s episode outcome. Outcome data was transformed using RStudio and the package
tidyverseinto heirarchical, numerical outcome scores ranging from 0 to 10, awarded for each contestant’s episode outcomes.Summary of Numerical Coding
Outcome Coded Criteria Points Assigned Overall Win (final episode) finale == 1 & outcome == "WIN"10 Overall Miss Congenitality (final episode) finale == 1 & missc == 1,outcome == "MISSCON"8 Main Challange Win outcome == "WIN"6 Mini Challange Win minichalw == 15 Top outcome == "HIGH"4 Safe, or Safe and Deptarted outcome == "SAFE",outcome == "SAFE + DEPT"3 Bottom (Non LipSync) outcome == "LOW"2 Shantied outcome == "BTM" & eliminated == 0"1 Eliminated, lost first round of finale lip syncs or did not appear or ‘RUNNING’ (effectively NA) outcome == "BTM" & eliminated == 1,outcome == "RTRN",outcome == "LOST2ND ROUND",outcome == "LOST1ST ROUND",outcome == "RUNNING"0 Returned (but did not contest) or Running (effectively NA) outcome == "RTRN",outcome == "RUNNING"filtered out
Outcome scores were then divided by the number of episodes each contestant appeared in to produce a ‘weighted outcome score’ in order to account for differing numbers of episode per season (series 1 had 7 episodes, latest seasons had 14) and individual queens returning for multiple seasons e.g. Eureka O’ Hara (featured in 17 episodes - intitally appeared in season 9, departed due to death-drop related injury, returned for season 10).
Both a running score by episode and a cummulative, weighted outcome score were calculated for each contestant.
Results
Table of Top 10 Contestants and Mean Average by Cumlative, Weighted Outcome Score
kable(top_10, col.names = c("Contestant", "Total Outcome Score"))| Contestant | Total Outcome Score |
|---|---|
| Bianca Del Rio | 4.916667 |
| Bob the Drag Queen | 4.900000 |
| BeBe Zahara Benet | 4.714286 |
| Tyra Sanchez | 4.700000 |
| Nina Flowers | 4.571429 |
| Jinkx Monsoon | 4.500000 |
| Sasha Velour | 4.500000 |
| Sharon Needles | 4.500000 |
| Violet Chachki | 4.461538 |
| Raja | 4.384615 |
| Mean Average | 2.623044 |
- Shows cumlative, weighted outcome scores of the top 10 contestants.
- Bianca Del Rio achieved the highest, cummulative weighted outcome score, but was followed closely by Bob the Drag Queen.
- Bianca Del Rio was well above the mean average cummulative, weighted outcome score.
- Data visualisations were produced from the running, weighted outcome scores per epsiode of each contestant.
Main Plot
main_plot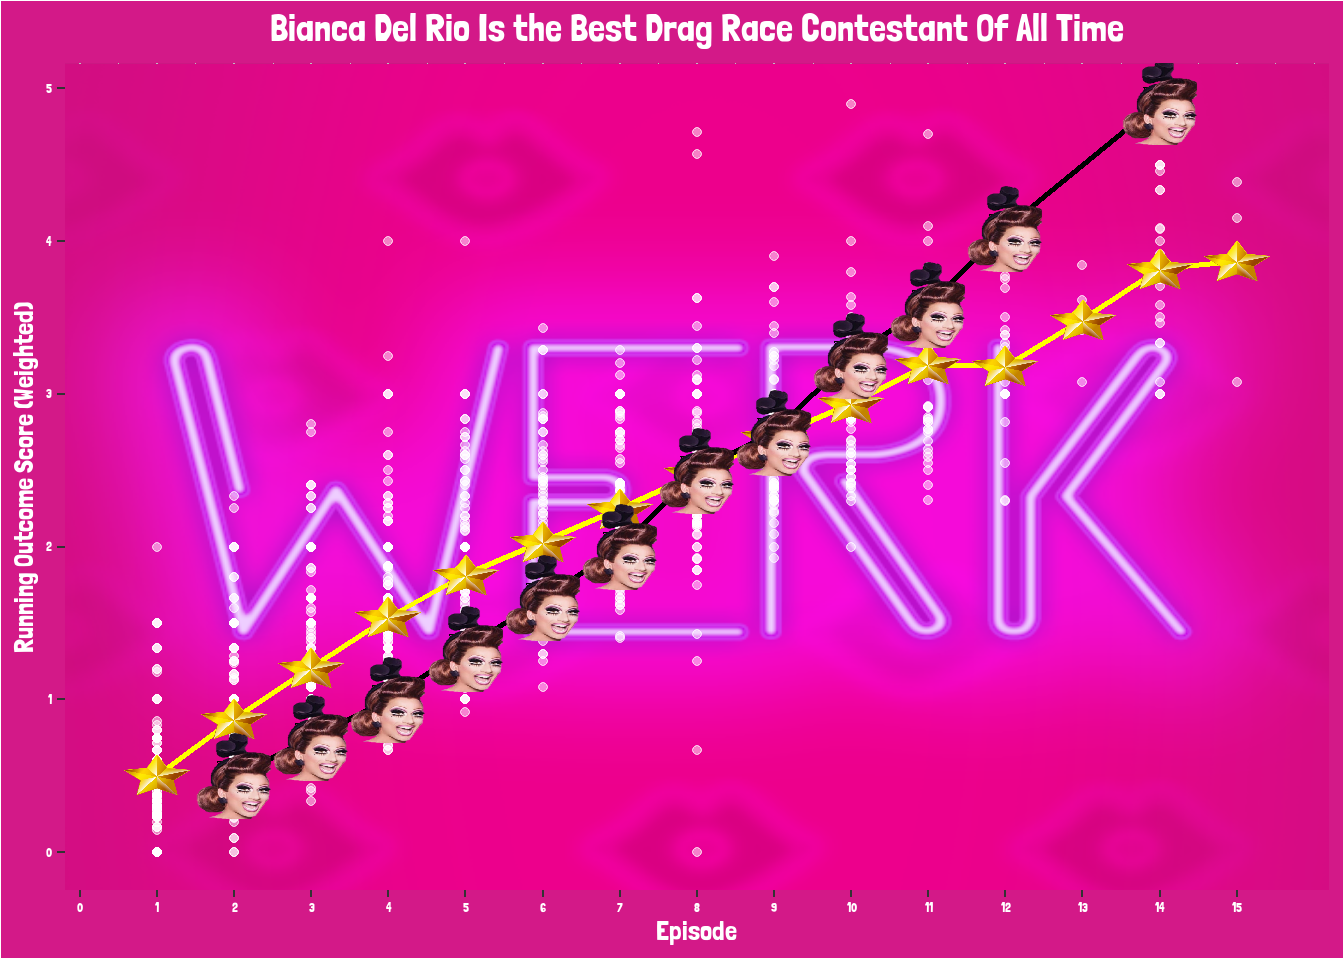
- Shows the individual running, weighted outcome scores by episode for each contestant (white points), with Bianca Del Rio’s running, weighted outcome score highlighted using her face. The mean average running total of all contestants is highlighted using yellow stars.
- Between episodes 1 to 7, Bianca Del Rio’s running, weighted outcome score is below the average running weighted outcome score, is approximately at the average after episode 8 and above the average running weighted outcome score after episode 8.
- By episode 14, Bianca Del Rio’s cummulative, weighted outcome score (the last of her running, weighted outcome score) is highest of all the contestants.
Interactive Main Plot
ggplotly(interactive_main_plot)- Identical plot to main plot but made interactive using
ggplotly. Bianca Del Rio’s running, weighted outcome score are highlighted using blue stars. The mean average running total of all contestants is highlighted using yellow stars.- Hover over individual data points to see individual contestants’ running, weighted outcome score by episode, labeled with contestant name.
Additional Line Plot - Top 5 and random contestant sample
ggplotly(top5_and_sample_plot)- Showsthe running, weighted outcome scores of the top 5 contestants by cummulative, weighted outcome score (including Bianca Del Rio in light green) with a random sample of 5 other contestants.
- Hover over individual data points to see individual contestants’ running, weighted outcome score by episode, labeled with contestant name.
Conclusion
- Bianca Del Rio is the best drag race contestant of all time when cumulative weighted outcome scores of RuPaul’s Drag Race contestants are compared.
- Data points for Bianca Del Rio are missing for episodes 1 because unlike other seasons, season 6 split the entrance of the queens between two episodes, and therefore Bianca entered in the second episode. A data point for Bianca Del Rio is also missing for episode 14 because this was a summary episode before the finale for season 6, which did not feature a competion.
- Bianca Del Rio’s below average performance before episode 8 may be a result of the calculation of the weighted outcome scores. Early seasons of Ru Paul’s Drag Race had fewer than 14 episodes, as few as 8, therefore the cumulative weighted outcome scores of queens from early seasons will have augmented the average to be higher (closer to their cumulative weighted outcome scores) than the running, weighted scores of the queens who were featured in more episodes. When the data for these contestants no longer appears (episode 8, onwards), Bianca Del Rio’s running, weighted scores show that she preformed better than others who also featured in up to 14 episodes and ultimately achieved the highest cumulative weighted outcome score of all the contestants.
Emily Nordmann
Senior Lecturer in Psychology
I am a teaching-focused Senior lecturer and conduct research into the relationship between learning, student engagement, and technology.