Personality and individual differences
Introduction
At the request of participants, this analysis is a summary of the results of a study conducted on personality and individual differences in the School of Psychology and Neuroscience, University of Glasgow, January - March 2022. This study was conducted as part of course requirements for our first year undergraduate course PSYCH1002. Students chose one personality trait and one demographic variable upon which to write a report/poster. It is important to note therefore that there were no formal hypotheses associated with the data collection and consequently no formal statistical tests will be presented.
Finally, it is not possible to request additional analyses and because of the student project nature of the research, the results will not be written up further.
Dr. Emily Nordmann 1st Year Lead School of Psychology and Neuroscience, University of Glasgow
Personality measures
The study used the Big Five Inventory 2 (BFI-2, Soto and John, 2017) to measure personality. The BFI-2 has five personality traits which are listed below with their facets:
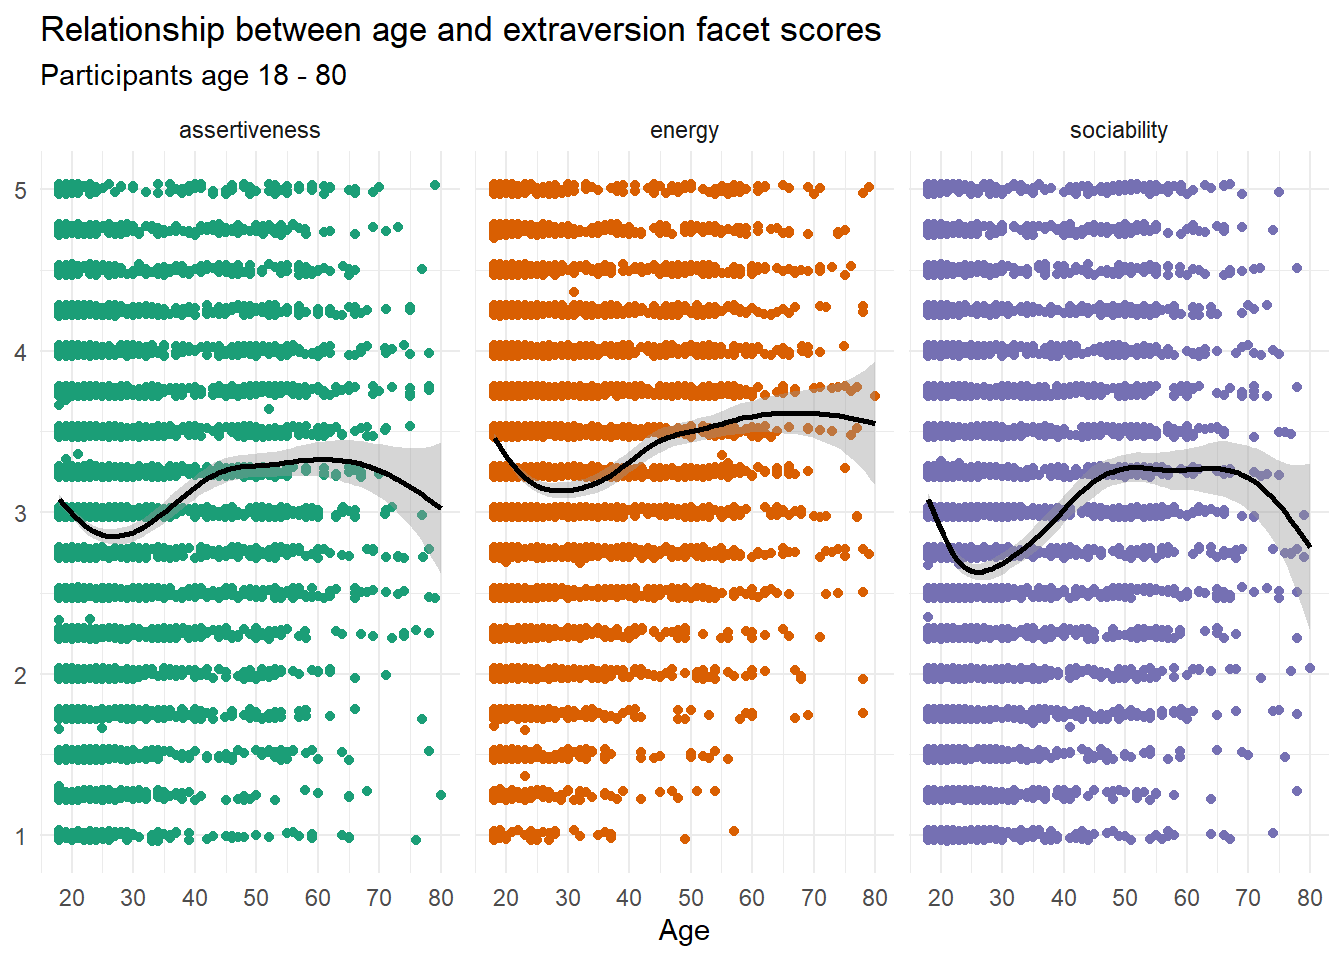
- Extraversion (sociability, assertiveness, energy level)
- Agreeableness (compassion, respectfulness, trust)
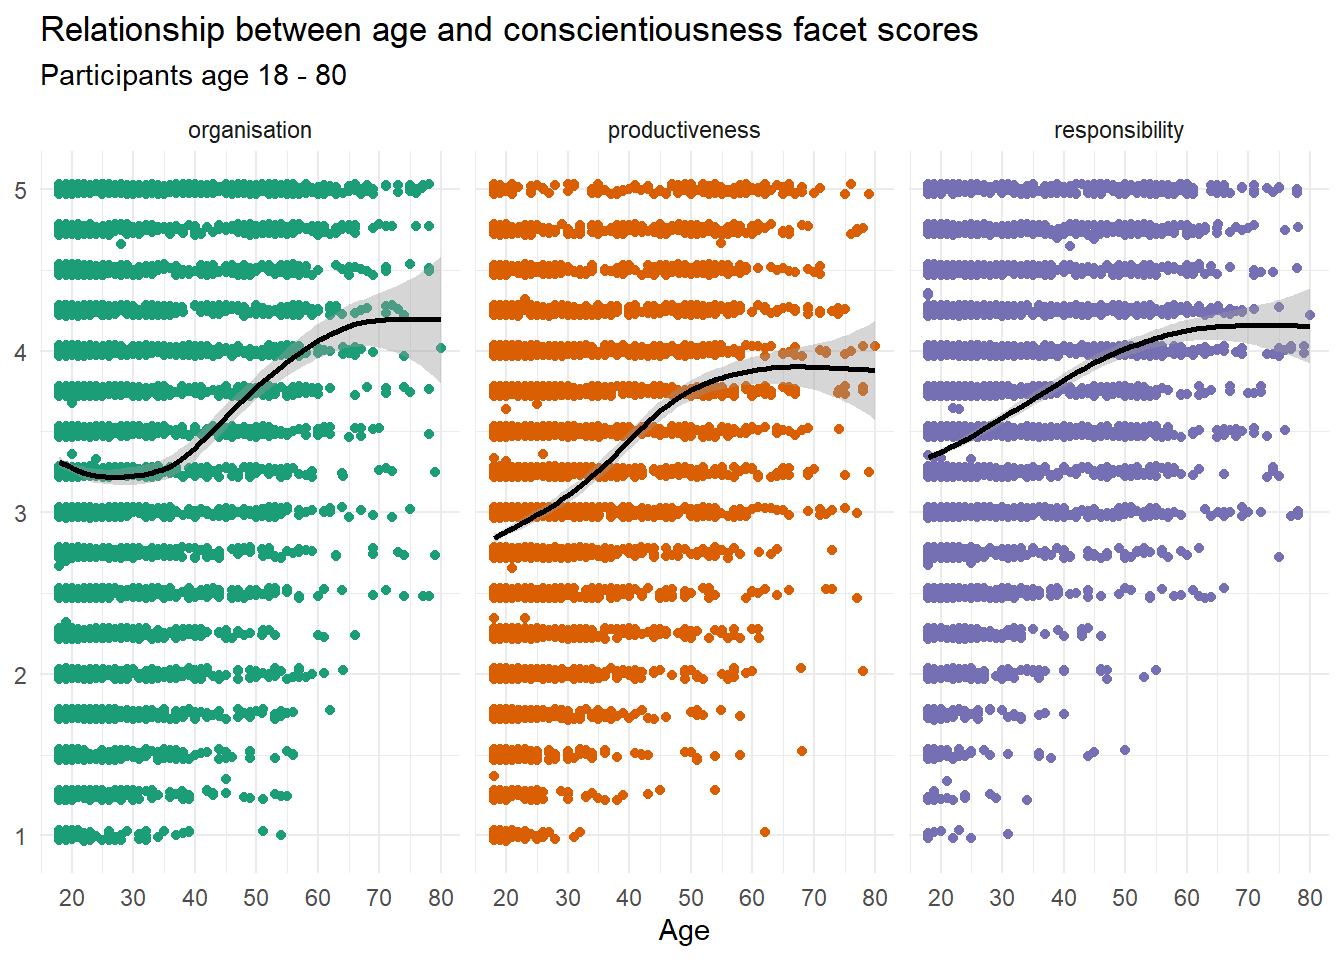
- Conscientiousness (organisation, productiveness, responsibility)
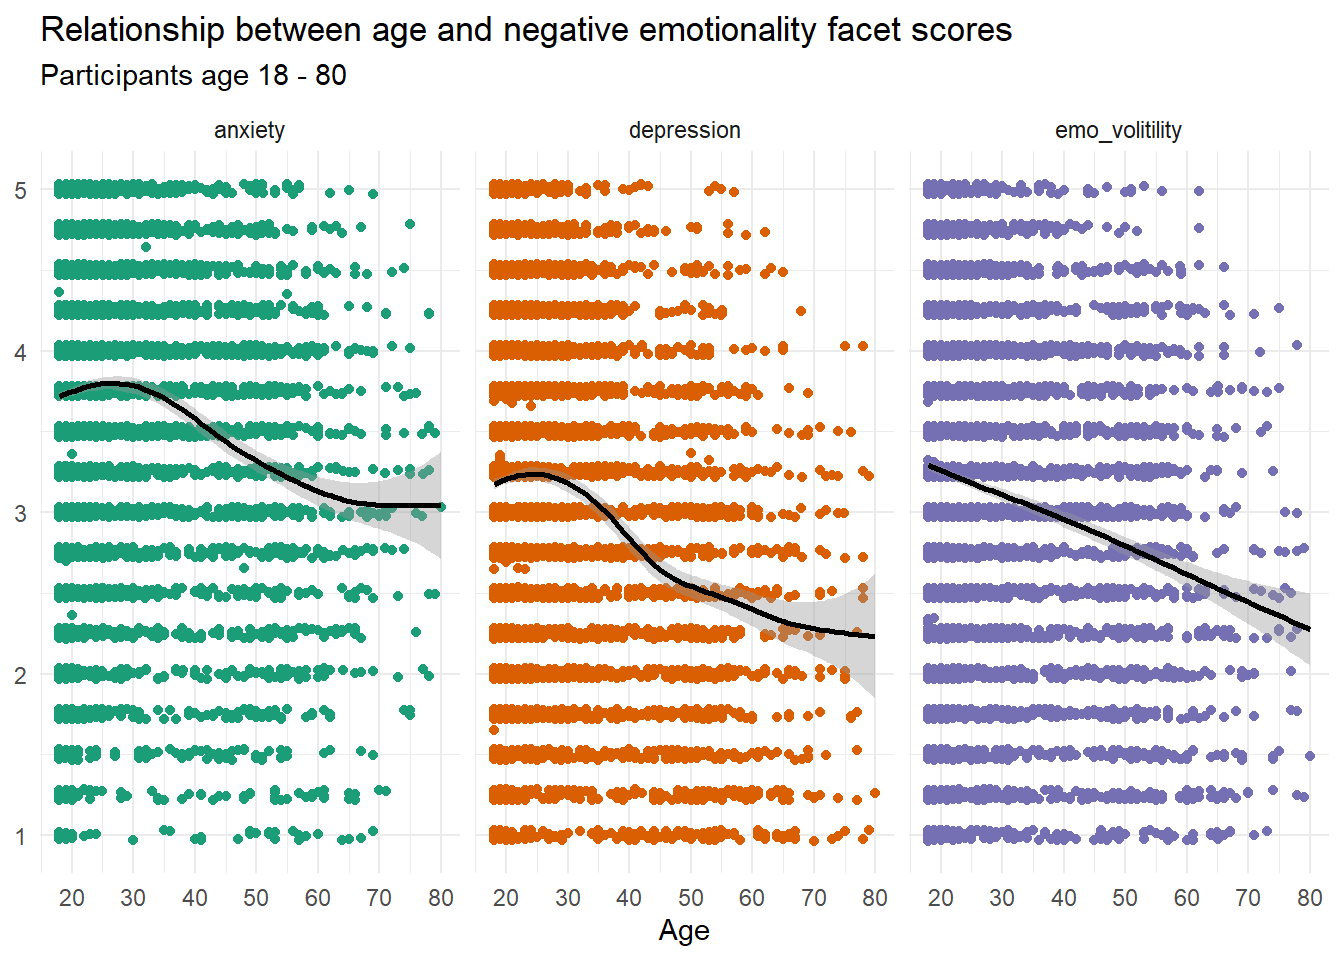
- Negative emotionality (anxiety, depression, emotional volatility)
- Open-mindedness (intellectual curiosity, aesthetic sensitivity, creative imagination)
The score for each personality trait was calculated as the mean of all items relating to that trait. Each trait had 12 items that participants rated on a scale of 1-5. Each facet had four associated items. Only participants who answered all questions are included in the analysis.
Sample context and limitations
Students on PSYCH1002 were encouraged to first take part in the study as participants to help their understanding of the survey, therefore, approximately 500 of the participants were 1st year students at the University of Glasgow, a prestigious, English-speaking institution.
Additionally, as part of the project requirements, students were required to recruit more participants using social media, therefore the remaining sample will also be heavily over-represented by university students. However, we did not collect information regarding each participant’s employment, socioeconomic status, education, ethnicity, location, or primary language, therefore no absolute conclusions can be drawn about the make-up of the sample on these variables although it is safe to assume that it is not broadly representative of the full population.
| gender | mean_age | sd_age | number | percent |
|---|---|---|---|---|
| Man | 25.62 | 13.03 | 2143 | 22.41 |
| Woman | 25.65 | 11.98 | 6260 | 65.47 |
| Non-binary | 22.28 | 6.38 | 874 | 9.14 |
| Prefer not to say | 21.62 | 8.77 | 180 | 1.88 |
| NA | 29.58 | 16.01 | 104 | 1.09 |
Trait scores (overall)
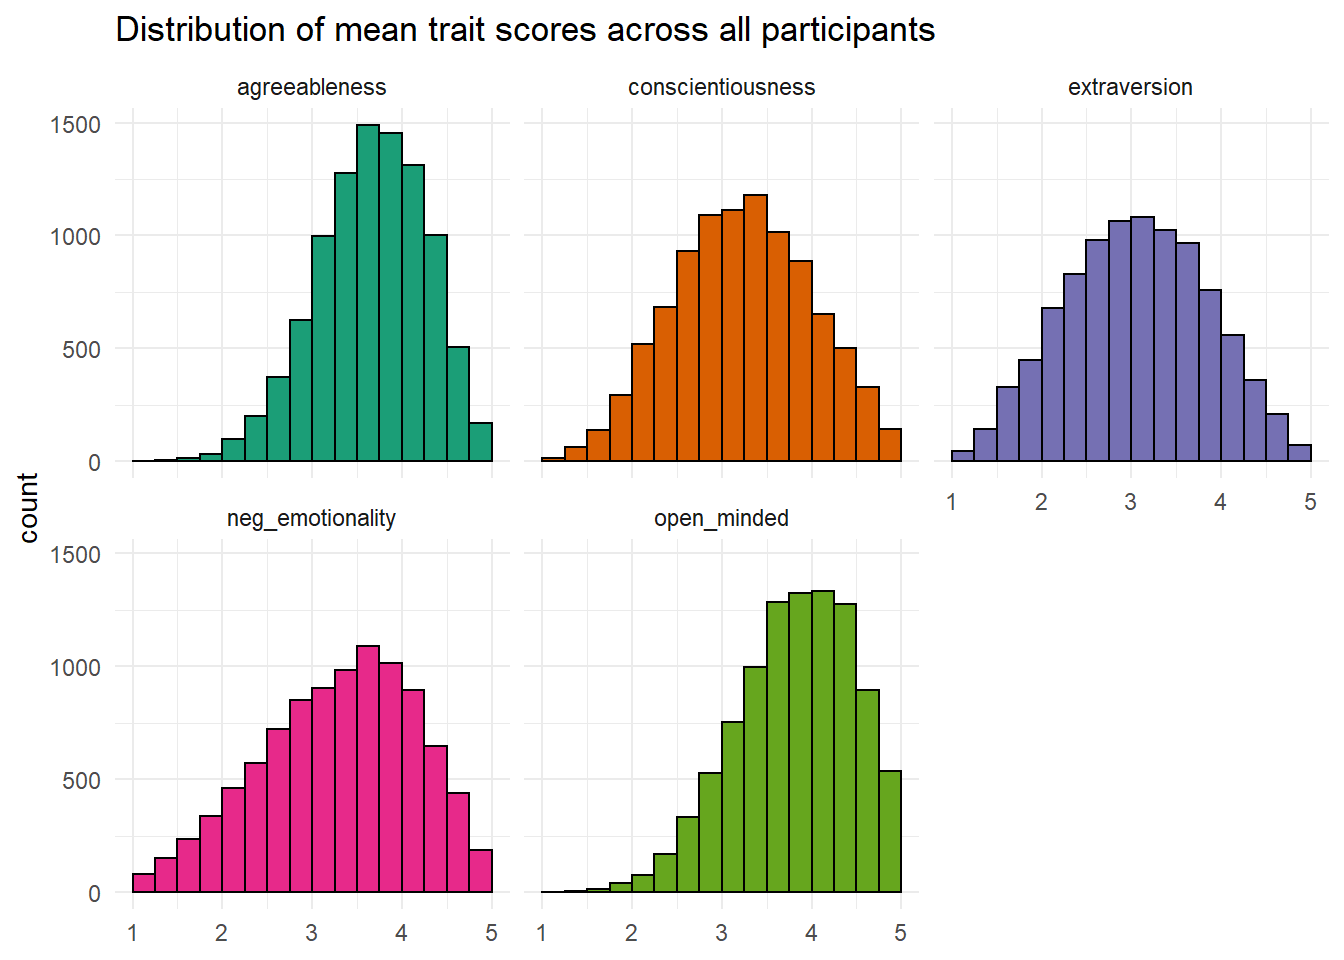
| trait | mean | median | sd | min | max |
|---|---|---|---|---|---|
| agreeableness | 3.70 | 3.75 | 0.60 | 1.25 | 5 |
| conscientiousness | 3.27 | 3.25 | 0.76 | 1.00 | 5 |
| extraversion | 3.09 | 3.08 | 0.79 | 1.00 | 5 |
| neg_emotionality | 3.33 | 3.42 | 0.85 | 1.00 | 5 |
| open_minded | 3.85 | 3.92 | 0.65 | 1.00 | 5 |
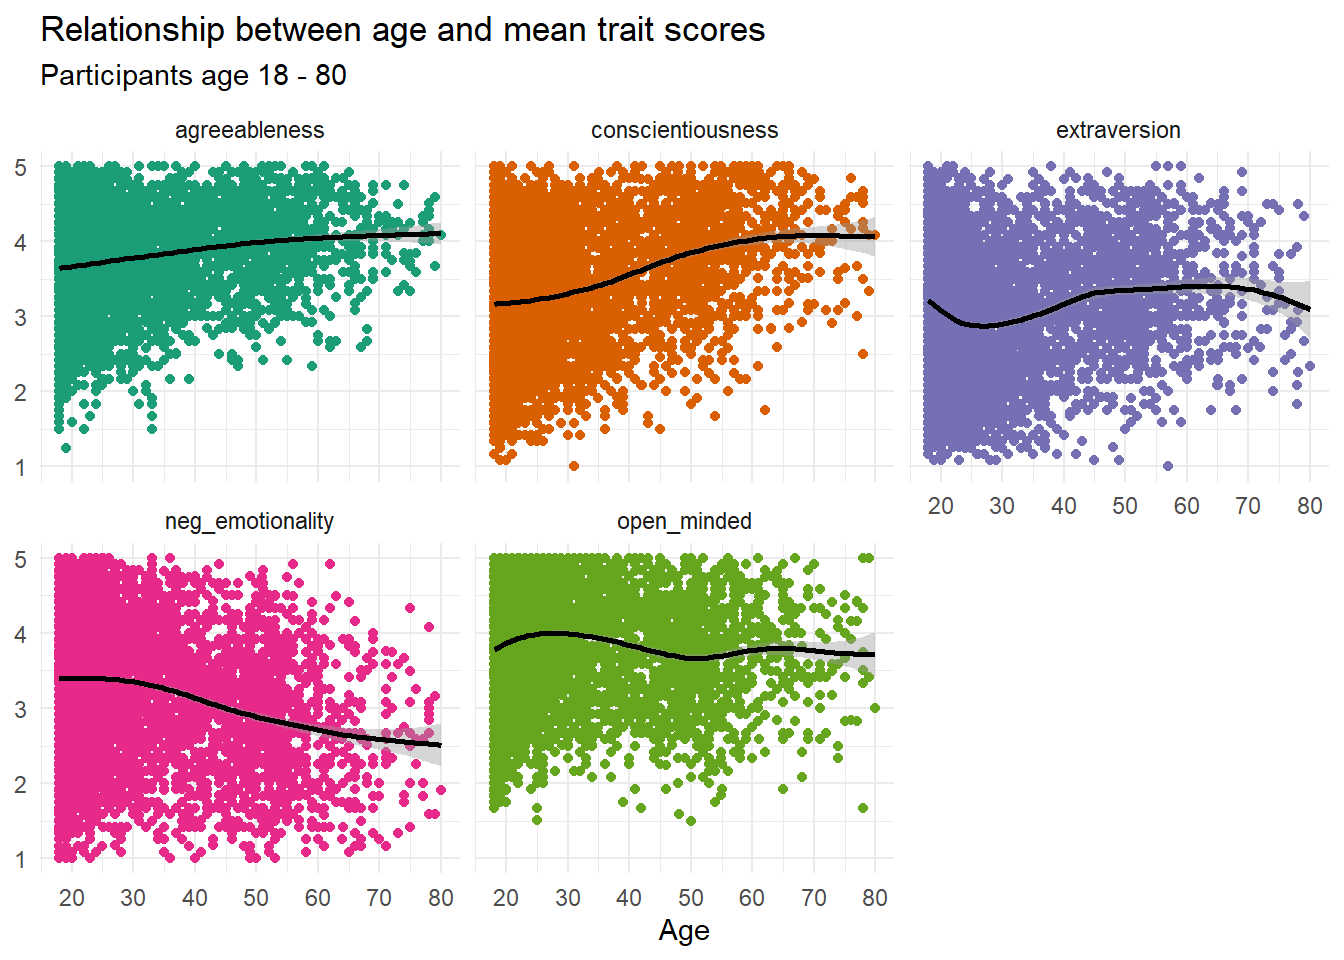
Across all participants, conscientiousness and extraversion are normally distributed, whilst agreeableness, negative emotionality, and open-mindedness all show evidence of a negative skew (i.e., there are fewer participants with very low scores).
Facet scores (overall)
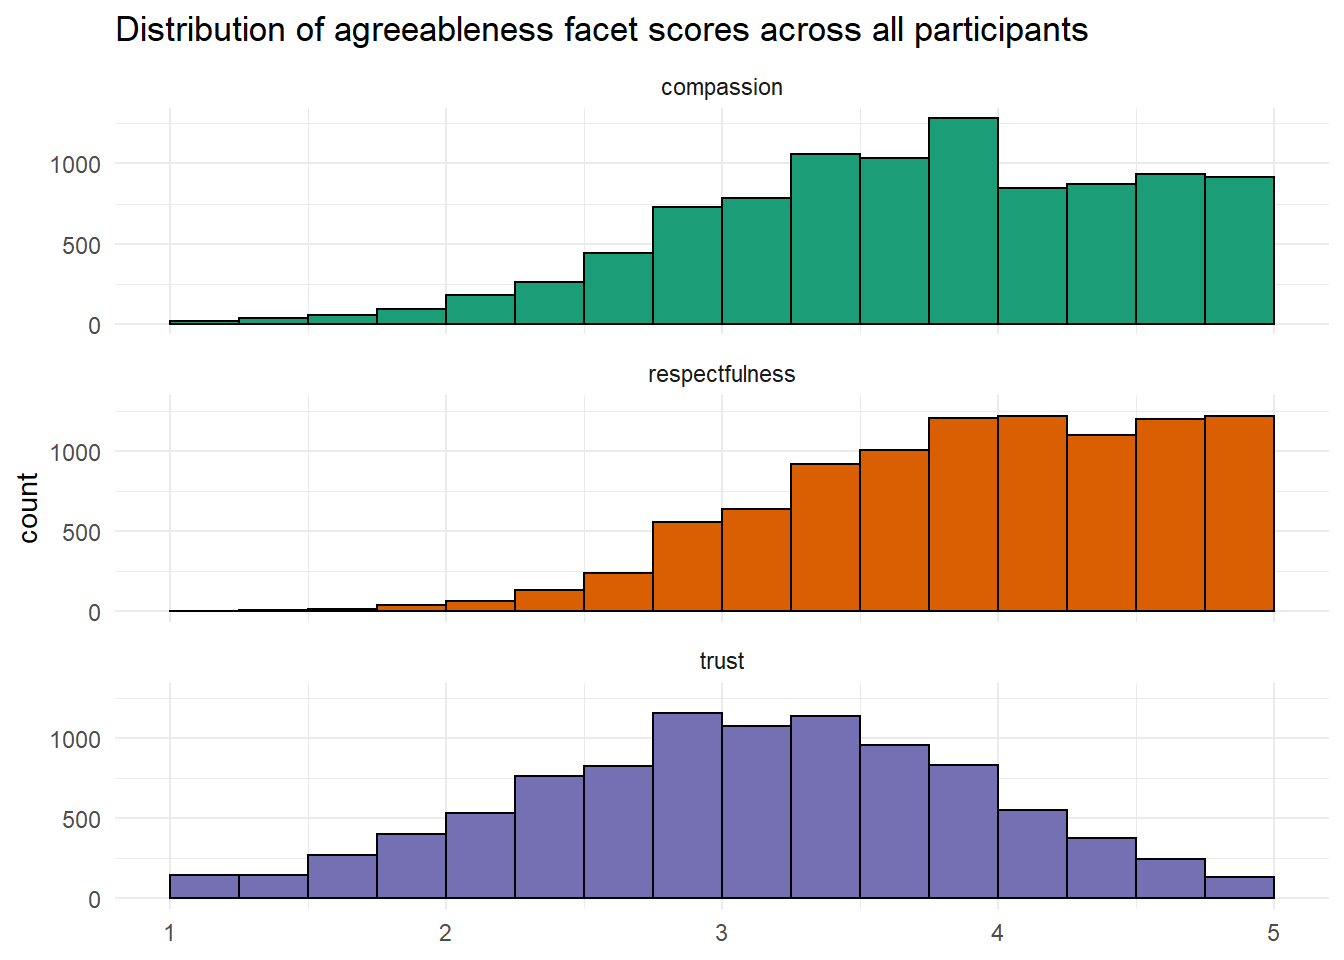
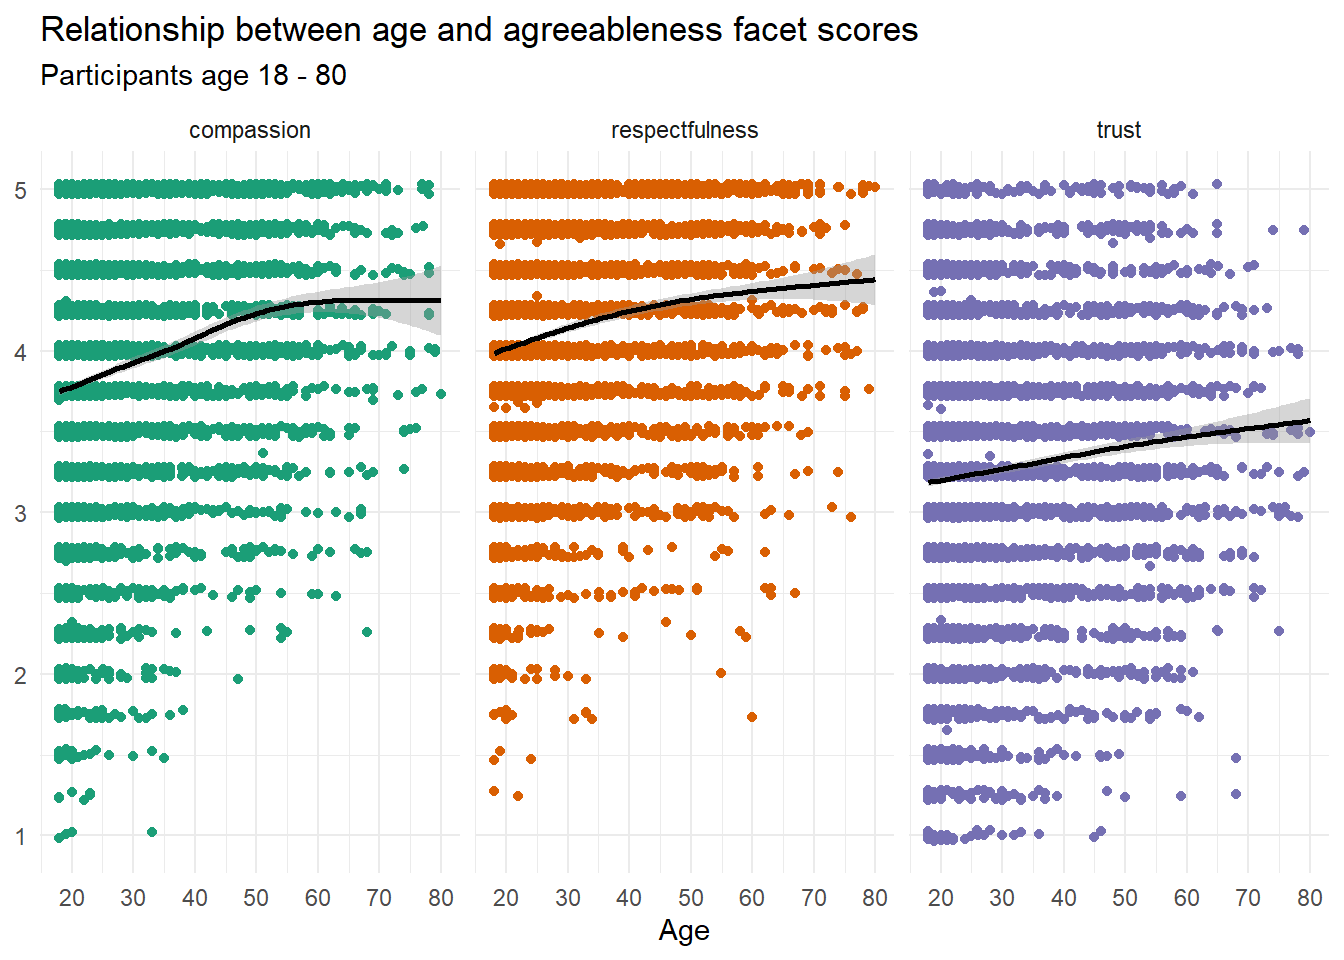
Agreeableness facets
| facet | mean | median | sd | min | max |
|---|---|---|---|---|---|
| compassion | 3.84 | 4.00 | 0.78 | 1.00 | 5 |
| respectfulness | 4.05 | 4.00 | 0.69 | 1.25 | 5 |
| trust | 3.22 | 3.25 | 0.82 | 1.00 | 5 |
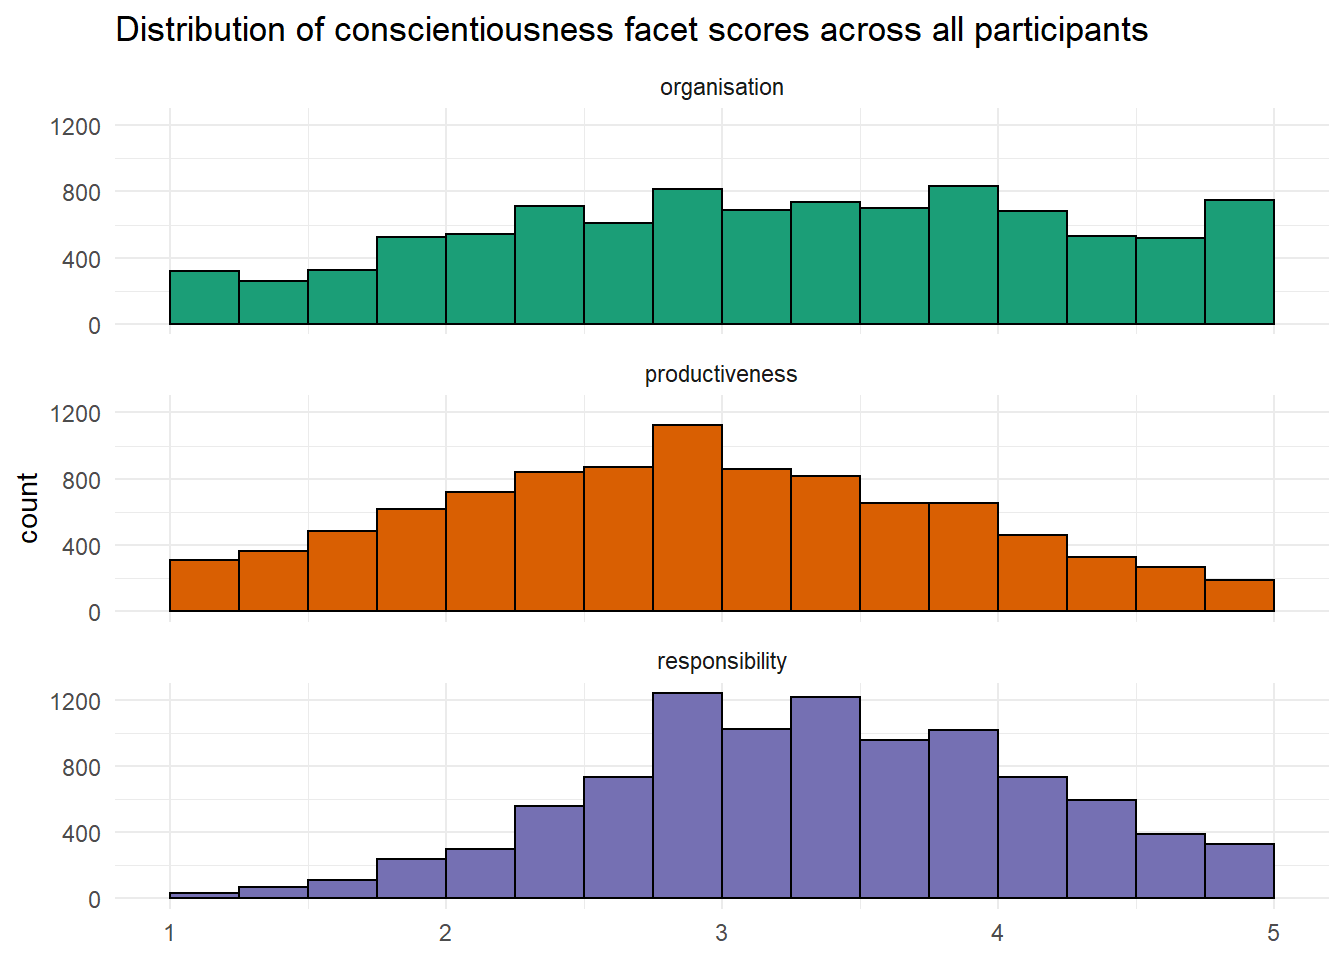
Conscientiousness facets
| facet | mean | median | sd | min | max |
|---|---|---|---|---|---|
| organisation | 3.33 | 3.25 | 1.05 | 1 | 5 |
| productiveness | 3.02 | 3.00 | 0.93 | 1 | 5 |
| responsibility | 3.47 | 3.50 | 0.78 | 1 | 5 |
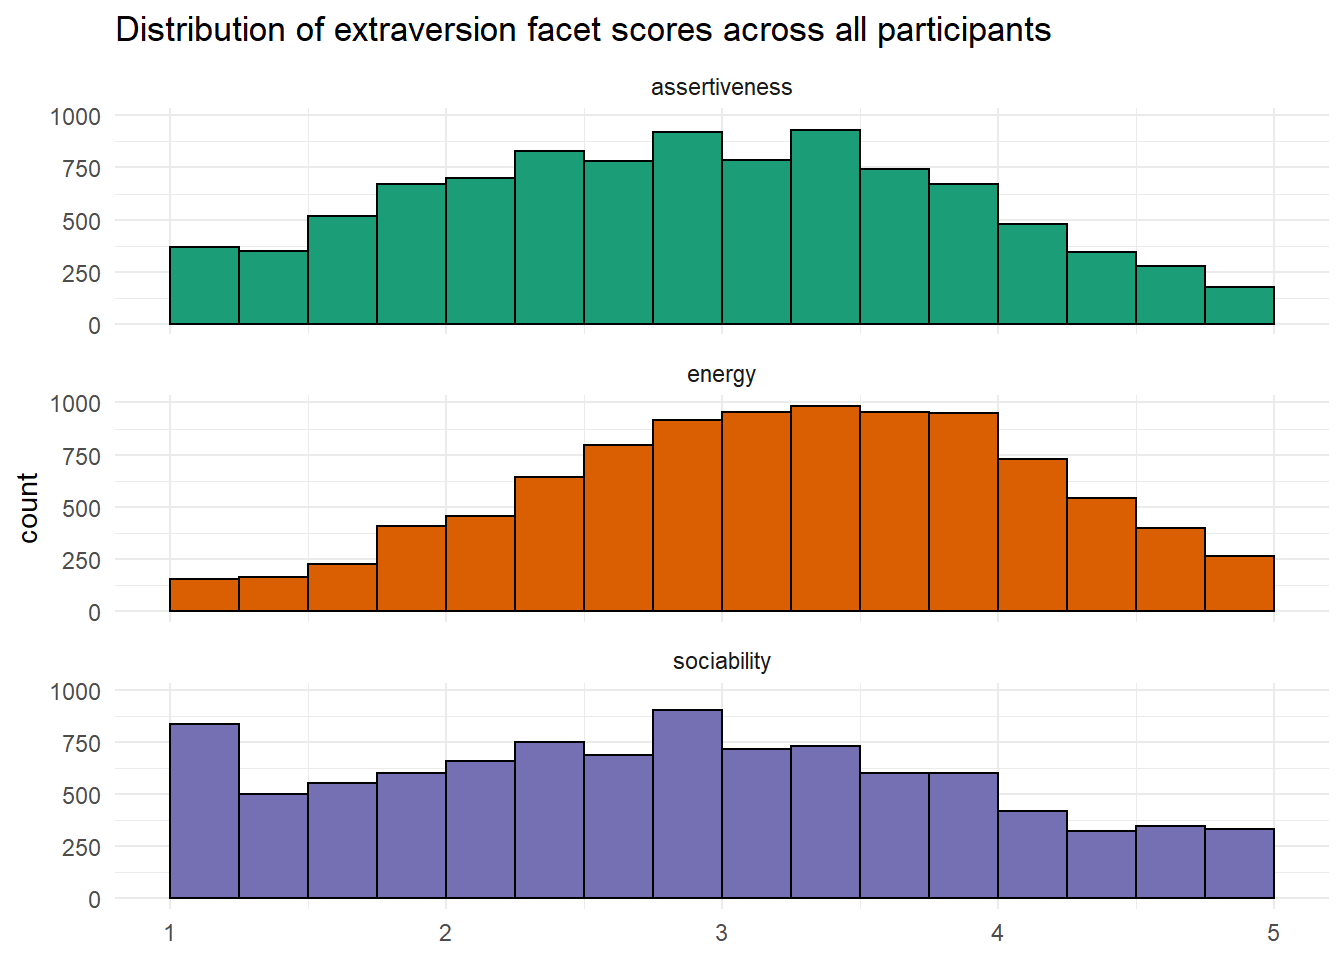
Extraversion facets
| facet | mean | median | sd | min | max |
|---|---|---|---|---|---|
| assertiveness | 3.02 | 3.0 | 0.95 | 1 | 5 |
| energy | 3.34 | 3.5 | 0.88 | 1 | 5 |
| sociability | 2.92 | 3.0 | 1.07 | 1 | 5 |
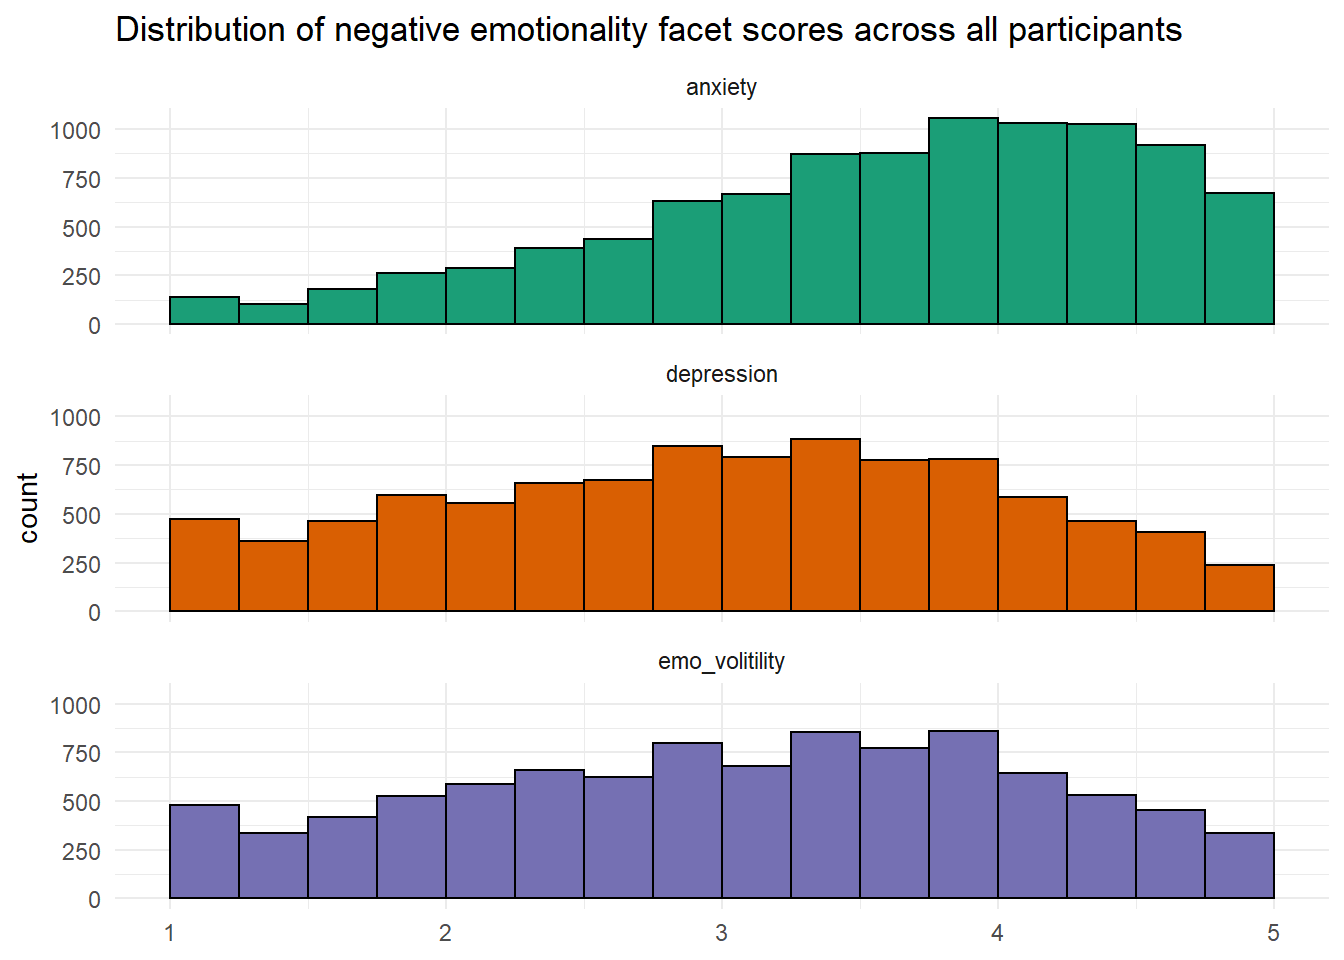
Negative emotionality facets
| facet | mean | median | sd | min | max |
|---|---|---|---|---|---|
| anxiety | 3.70 | 3.75 | 0.92 | 1 | 5 |
| depression | 3.12 | 3.25 | 1.01 | 1 | 5 |
| emo_volitility | 3.18 | 3.25 | 1.04 | 1 | 5 |
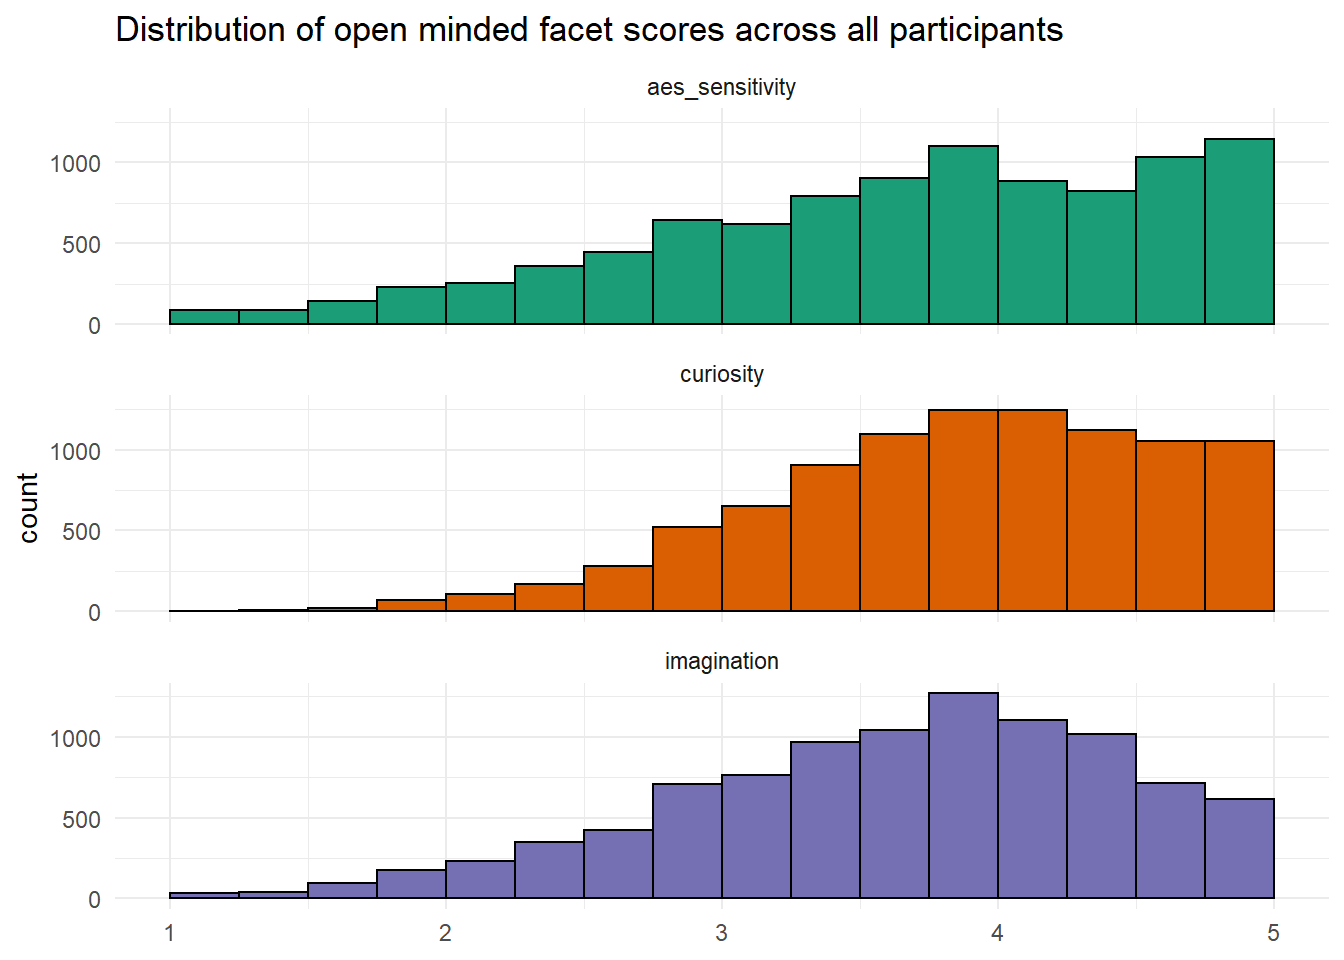
Open-mindedness facets
| facet | mean | median | sd | min | max |
|---|---|---|---|---|---|
| aes_sensitivity | 3.79 | 4.00 | 0.92 | 1.00 | 5 |
| curiosity | 4.00 | 4.00 | 0.71 | 1.25 | 5 |
| imagination | 3.76 | 3.75 | 0.80 | 1.00 | 5 |
Individual differences
Below, trait scores are analysed according to their relationship with different demographic groups. It is worth noting that because these analyses are presented separately by demographic variable, there are likely confounds or interactions that are not accounted for. For example, the non-binary sample has a lower mean age than either men or women and given the relationship between age and several of the traits and facets, some of the results for non-binary are likely to be confounded by age. That is, with the analysis that is presented in this document, you cannot definitively conclude if any differences are attributable to gender or age, or a combination of the two.
Age
Trait scores
Facet scores
Agreeableness
Conscientiousness
Extraversion
Negative emotionality
Gender
Participants were given the following options:
- Man
- Woman
- If you describe your gender with another term, please list this here
- Prefer not to say
For the purposes of analysis, participants who described their gender with another term were categorised under the non-binary umbrella term. Those who responded prefer not to say or who did not complete the question have been removed from the below analyses for brevity.
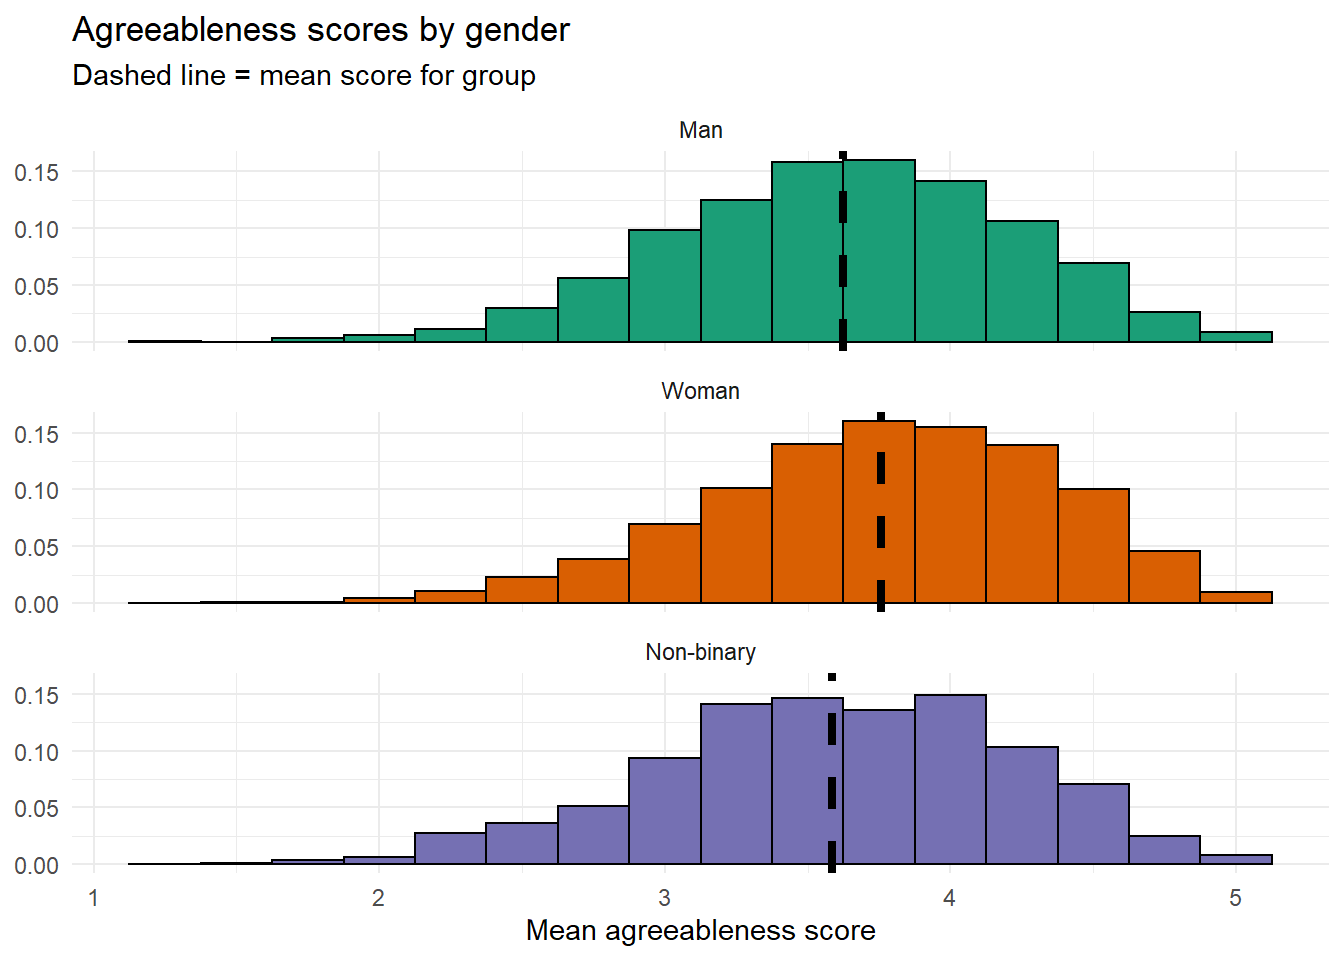
Finally, the following analyses are only presented at the trait rather than facet level due to the number of groups and the distributions are shown in proportions rather than raw counts because of difference sample sizes in each group.
| gender | n | percent |
|---|---|---|
| Man | 2143 | 22.41 |
| Woman | 6260 | 65.47 |
| Non-binary | 874 | 9.14 |
All traits
| trait | Man | Woman | Non-binary |
|---|---|---|---|
| agreeableness | 3.62 | 3.76 | 3.59 |
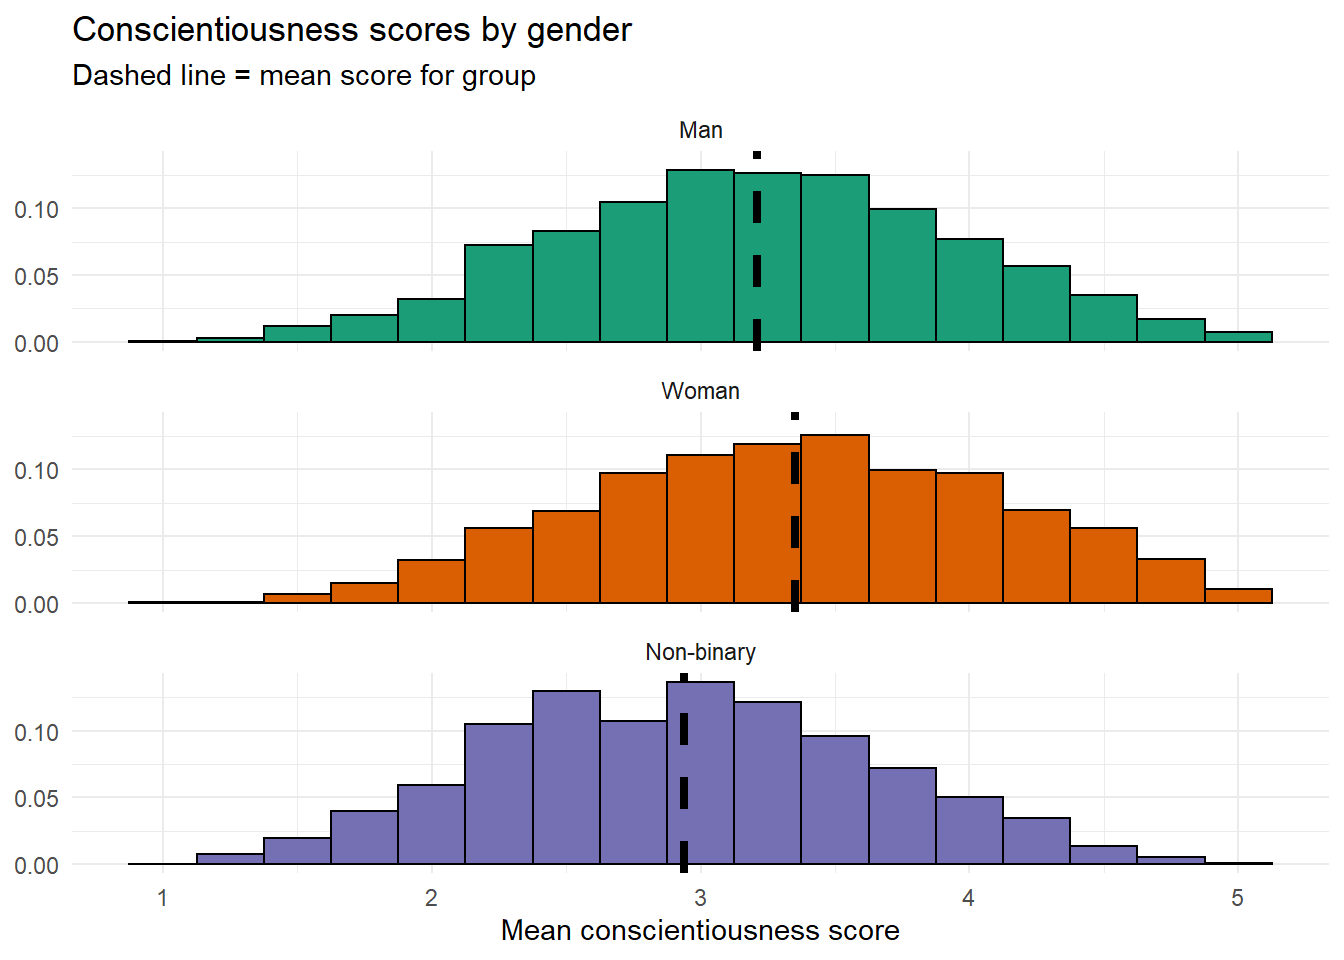
| conscientiousness | 3.21 | 3.35 | 2.94 |
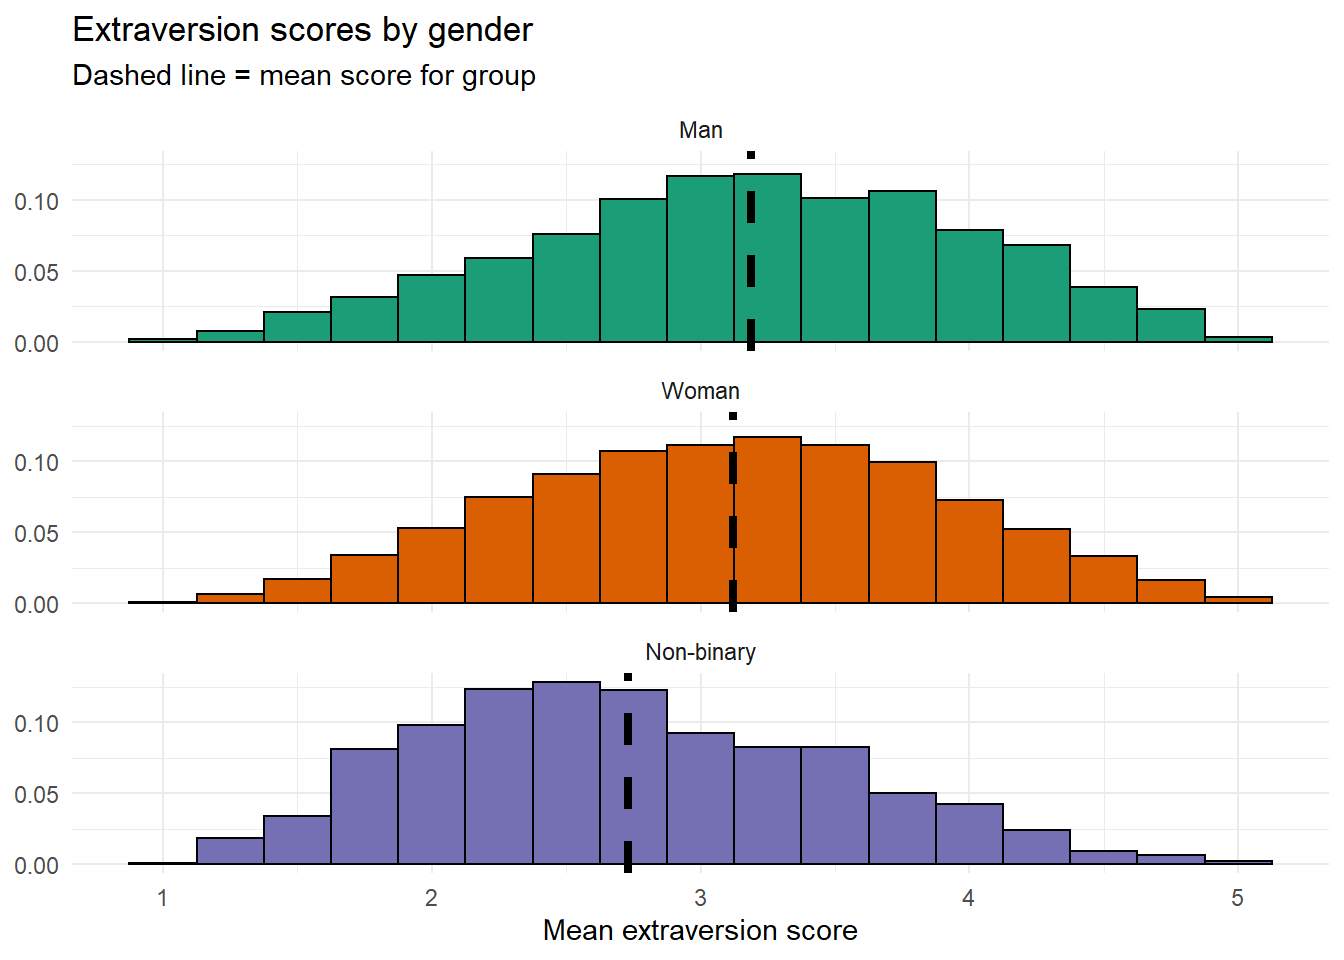
| extraversion | 3.19 | 3.12 | 2.73 |
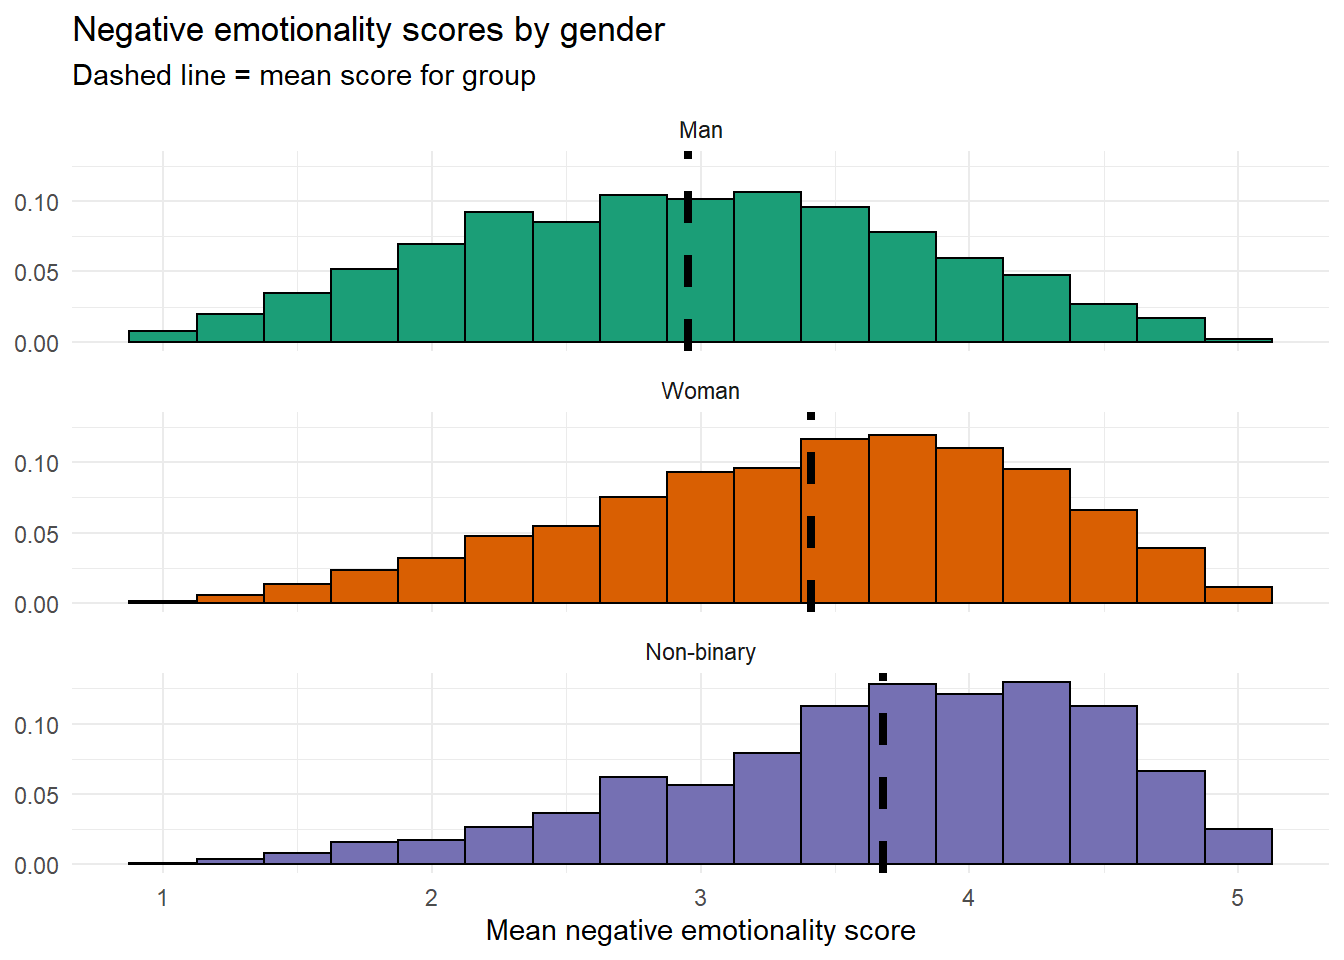
| neg_emotionality | 2.95 | 3.41 | 3.68 |
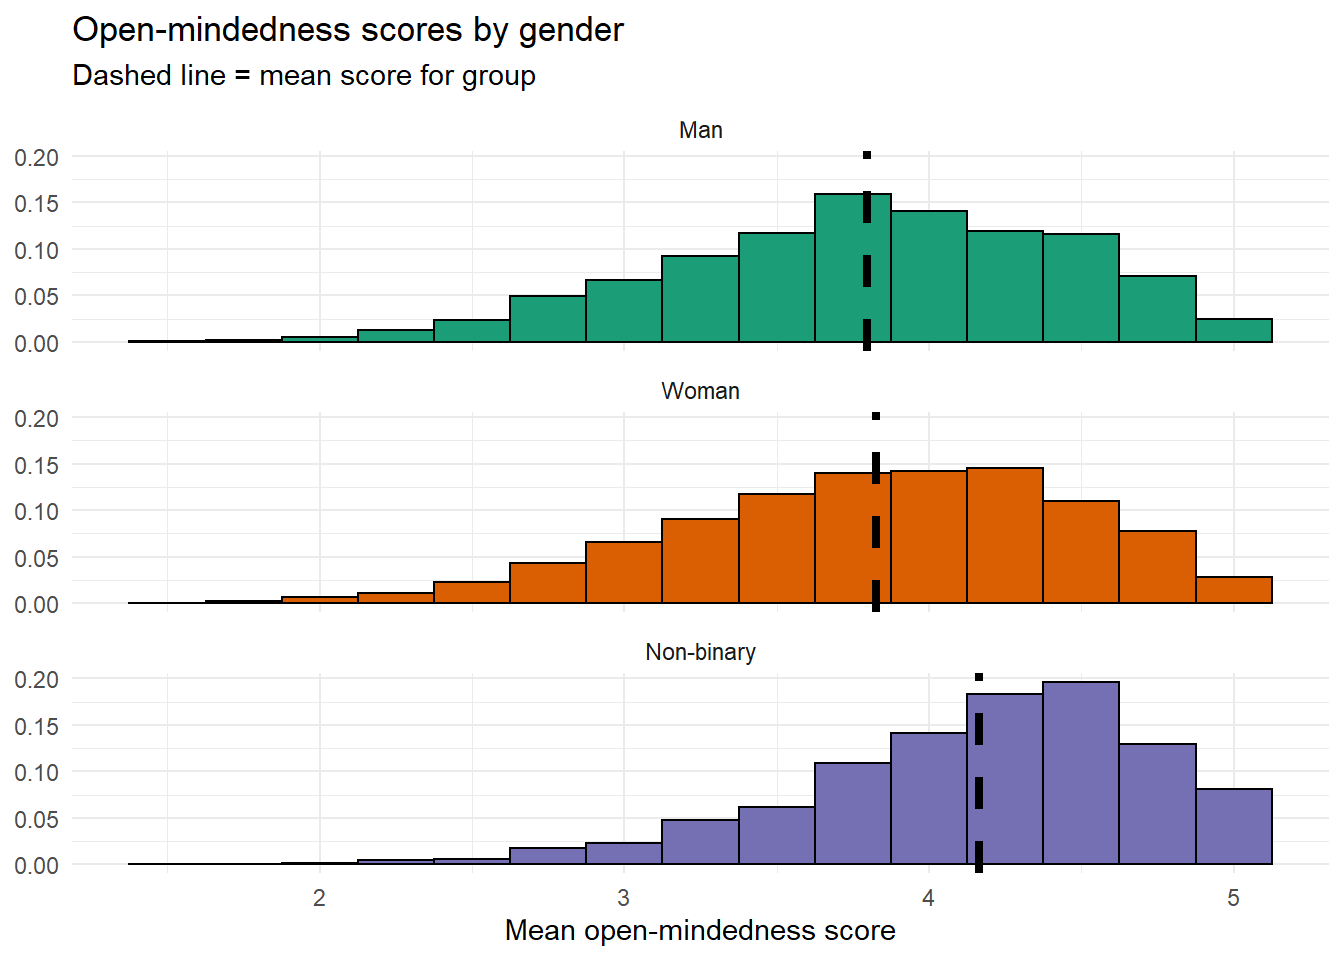
| open_minded | 3.80 | 3.83 | 4.16 |
Agreeableness
Women report slightly higher agreeableness scores than men or non-binary people although the distributions are all very similar.
Conscientiousness
Non-binary people report lower conscientiousness scores than women or men. Women report slightly higher conscientiousness scores than men.
Extraversion
Non-binary people report lower extraversion scores than men or women, whose distributions are very similar.
Negative emotionality
Non-binary people report higher negative emotionality scores than women, who in turn report higher negative emotionality scores than men.
Open-mindedness
Non-binary people report higher open-mindedness scores than women and men, who have very similar distributions.
Sexual orientation
Participants are given the following options:
- Straight/heterosexual
- Gay or lesbian
- Bisexual/pansexual
- Asexual
- If you describe your sexual orientation with another term, please list this here Pr* er not to say
For the purposes of analysis, those who described their sexual orientation with another term, responded prefer not to say or who did not complete the question have been removed from the below analyses for brevity.
There is a disproportionately large number of asexual participants compared to estimates for the population (~1%). One of the student groups for the project specifically aimed to study asexual people and undertook an extremely successful recruitment drive. I am very proud of them for the effort they went to for a 1st year project.
| sexual_orientation | n | percent |
|---|---|---|
| Straight/ Heterosexual | 4915 | 51.41 |
| Asexual | 2347 | 24.55 |
| Bisexual/pansexual | 1163 | 12.16 |
| Gay or Lesbian | 379 | 3.96 |
All traits
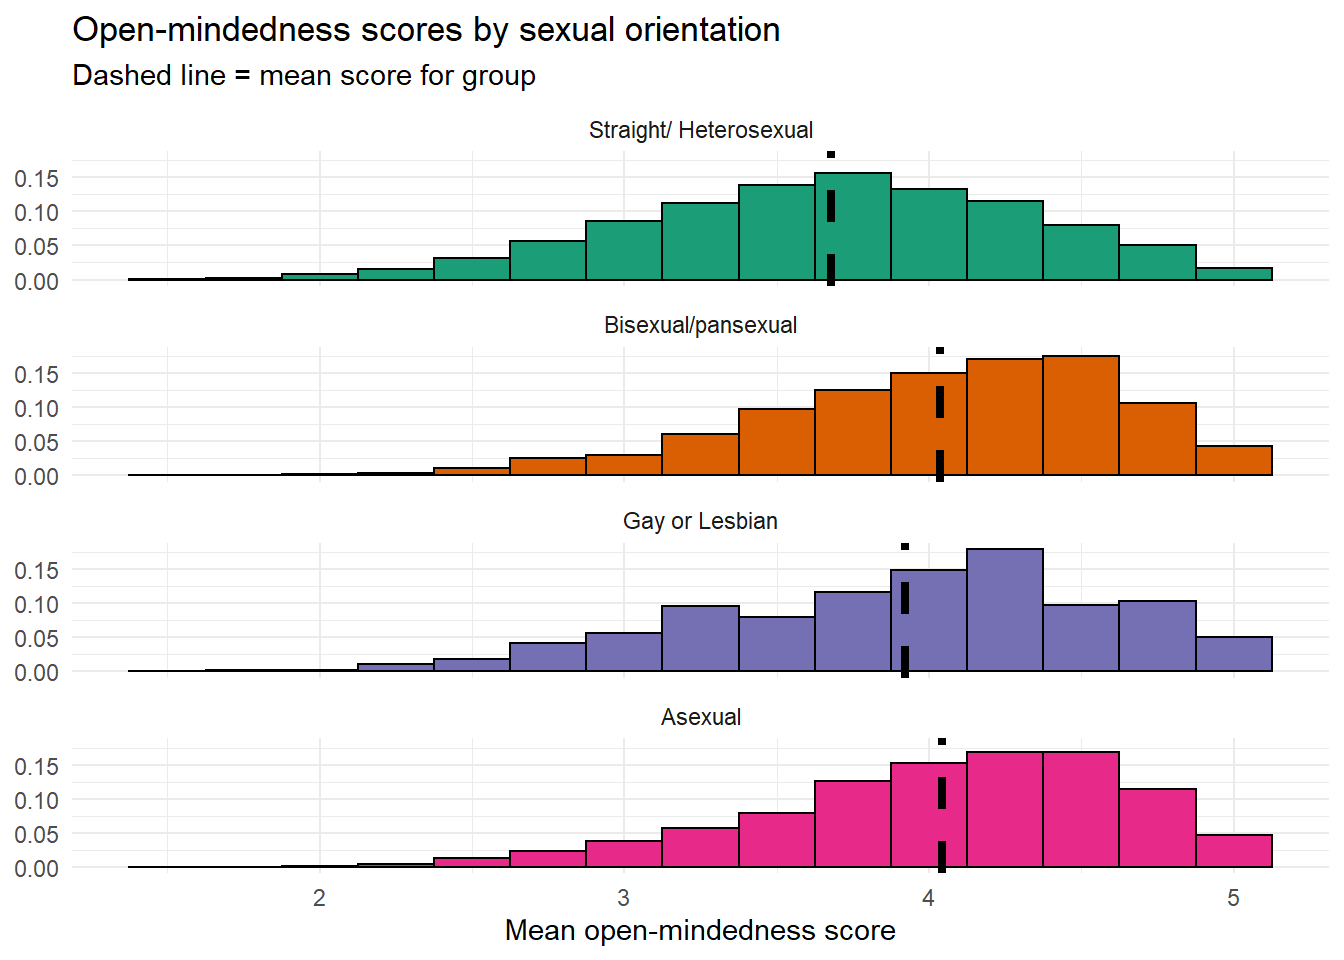
| trait | Straight/ Heterosexual | Bisexual/pansexual | Gay or Lesbian | Asexual |
|---|---|---|---|---|
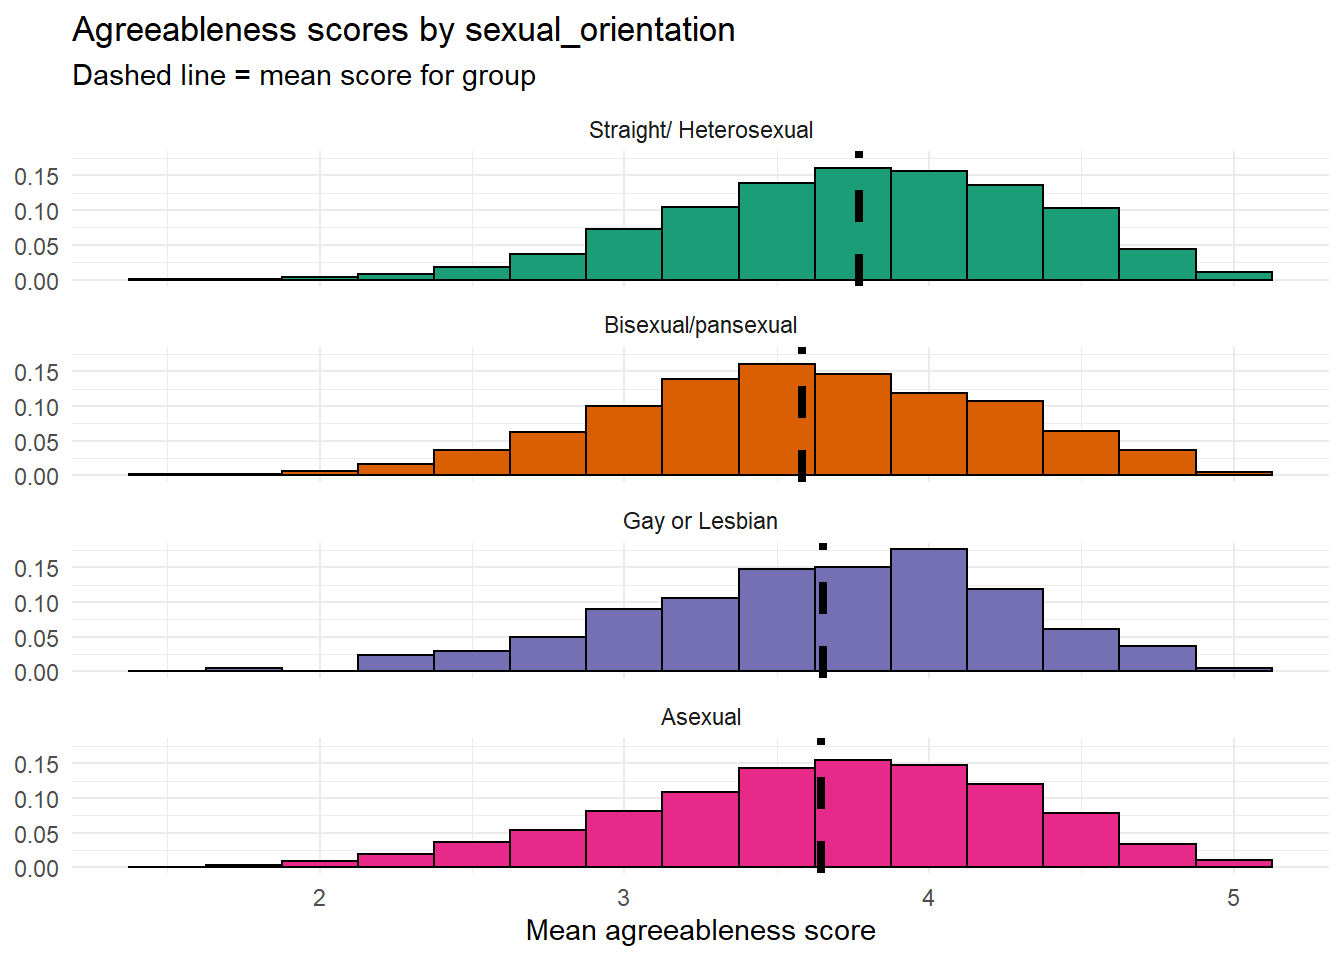
| agreeableness | 3.77 | 3.58 | 3.65 | 3.65 |
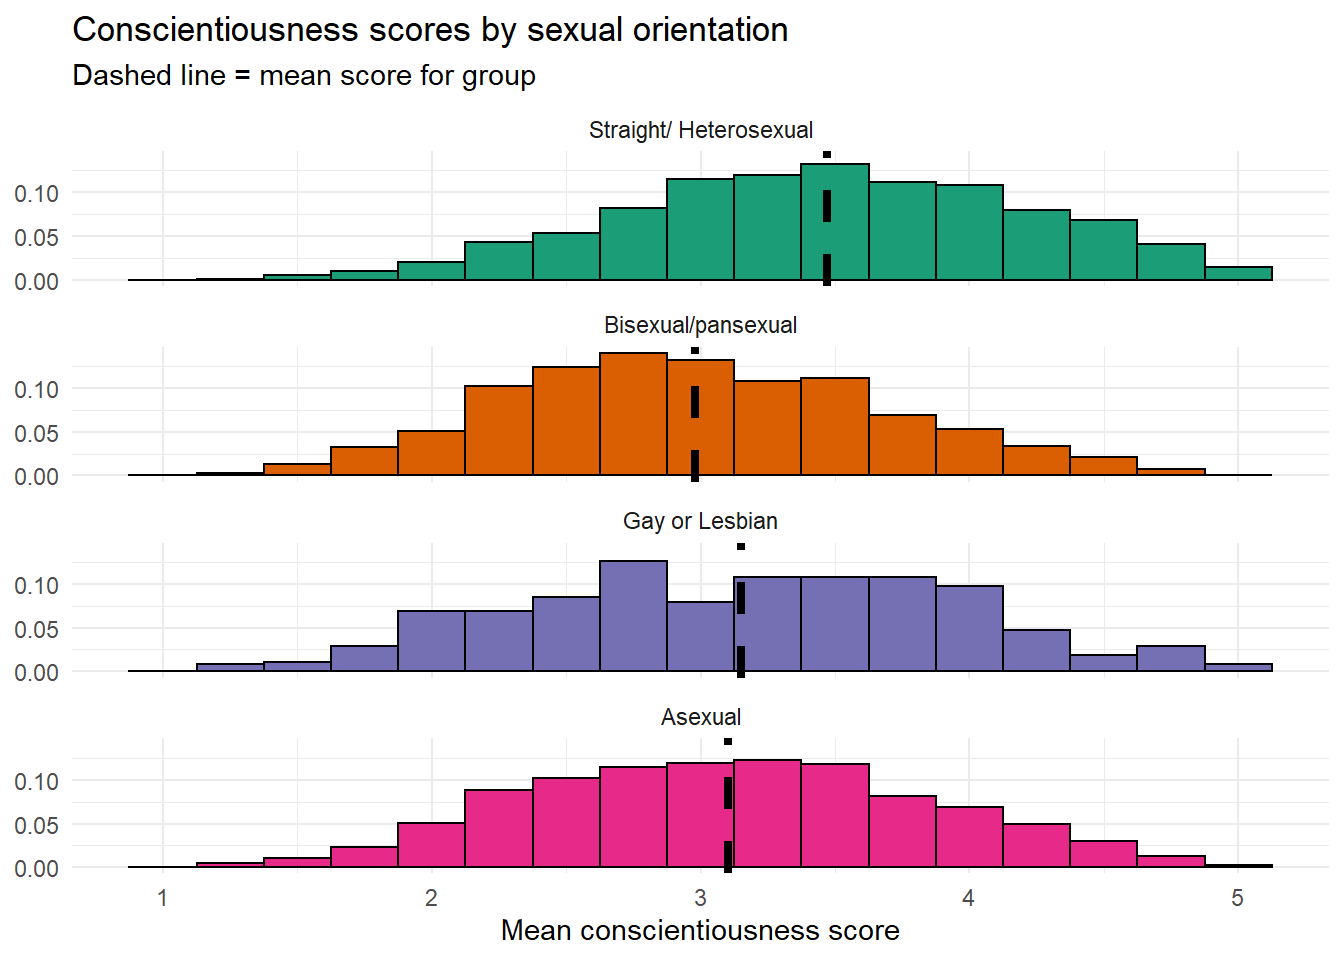
| conscientiousness | 3.47 | 2.98 | 3.15 | 3.10 |
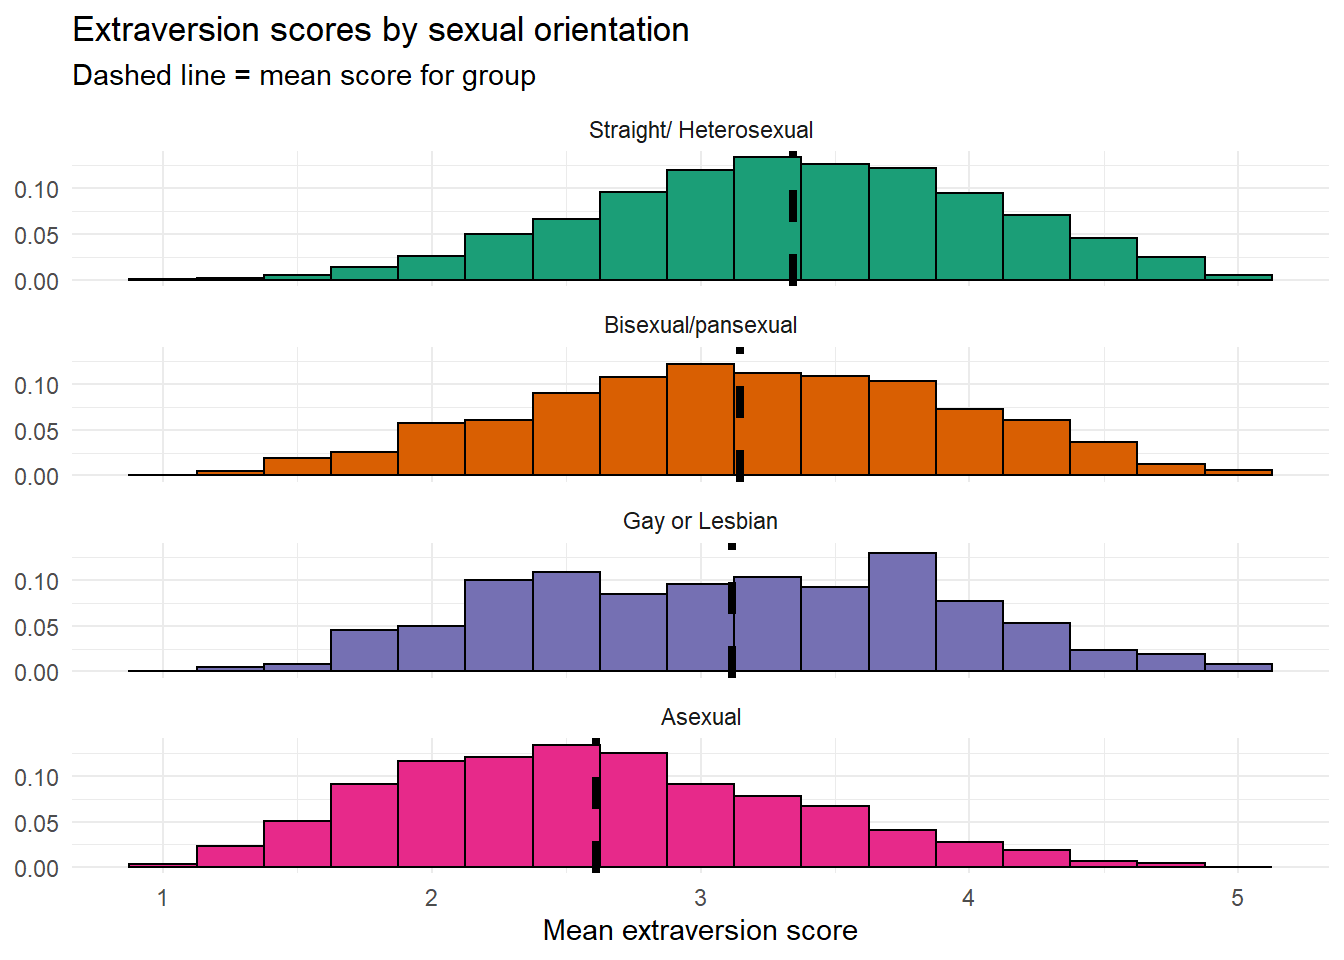
| extraversion | 3.34 | 3.15 | 3.12 | 2.61 |
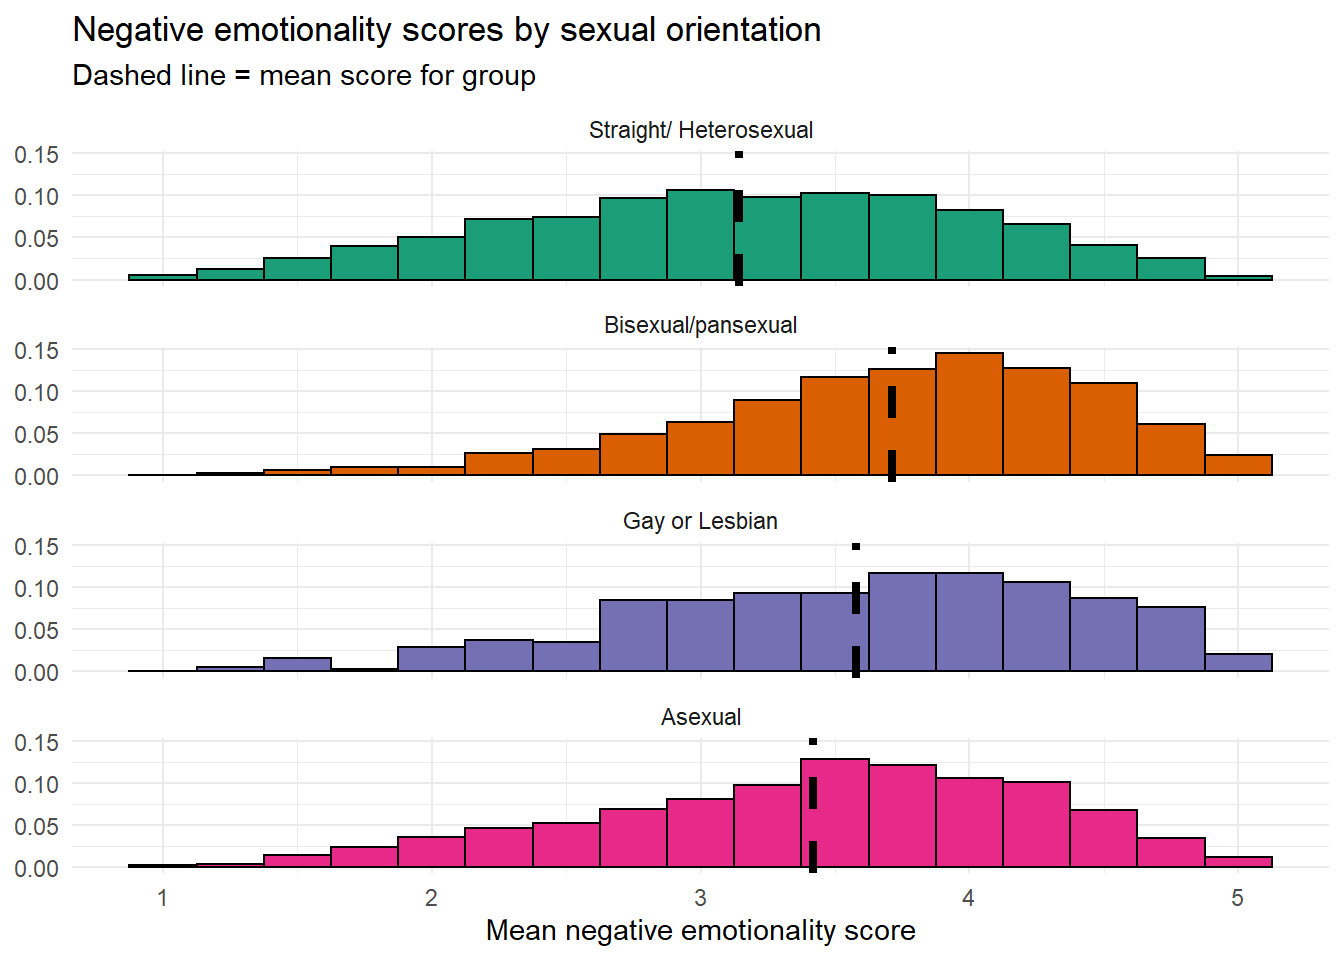
| neg_emotionality | 3.14 | 3.71 | 3.58 | 3.42 |
| open_minded | 3.68 | 4.03 | 3.92 | 4.04 |
Agreeableness
Heterosexual participants report slightly higher agreeableness scores than bisexual/pansexual, gay or lesbian, or asexual participants, although the difference is relatively minor and the distributions are all quite similar.
Conscientiousness
Heterosexual participants report higher conscientiousness scores than gay or lesbian or asexual participants, who in turn report higher scores than bisexual particpants.
Extraversion
Heterosexual people report higher extraversion scores than gay or lesbian and bisexual/pansexual people, who in turn report higher extraversion scores than asexual people.
Negative emotionality
Bisexual/pansexual people reported higher negative emotionality followed by gay or lesbian then asexual people. Heterosexual participants report the lowest negative emotionality.
Open-mindedness
Heterosexual participants reported the lowest open-mindedness followed by gay or lesbian and then bisexual/pansexual and asexual people, the latter two groups being extremely similar in distribution and mean scores.
Neurodiversity
Participants were given the following definition and options:
Neurodivergent is an umbrella term for an evolving list of diagnoses that reflect different neurotypes. Usually referring to autism, ADHD, and specific learning differences like dyslexia, dyspraxia, dyscalculia and more. Do you identify as neurodivergent?
- No
- Yes currently diagnosed
- Yes seeking diagnosis
- Yes but not seeking/sought diagnosis
- Prefer not to say
For the purposes of analysis, those who responded prefer not to say or who did not complete the question have been removed from the below analyses for brevity. Anyone who responded to any of the “yes” options above was categorised as neurodivergent. Anyone who responded “no” was categorised as neurotypical.
Additionally, we did not collect data on which neurotype participants identified as and it would be reasonable to predict that personality profiles may differ between e.g., autistic people and those with ADHD, therefore this is a limitation of the study.
| neurodivergent | n | percent |
|---|---|---|
| Neurotypical | 6323 | 66.13 |
| Diagnosed | 1197 | 12.52 |
| Seeking diagnosis | 847 | 8.86 |
| Not seeking diagnosis | 796 | 8.33 |
All traits
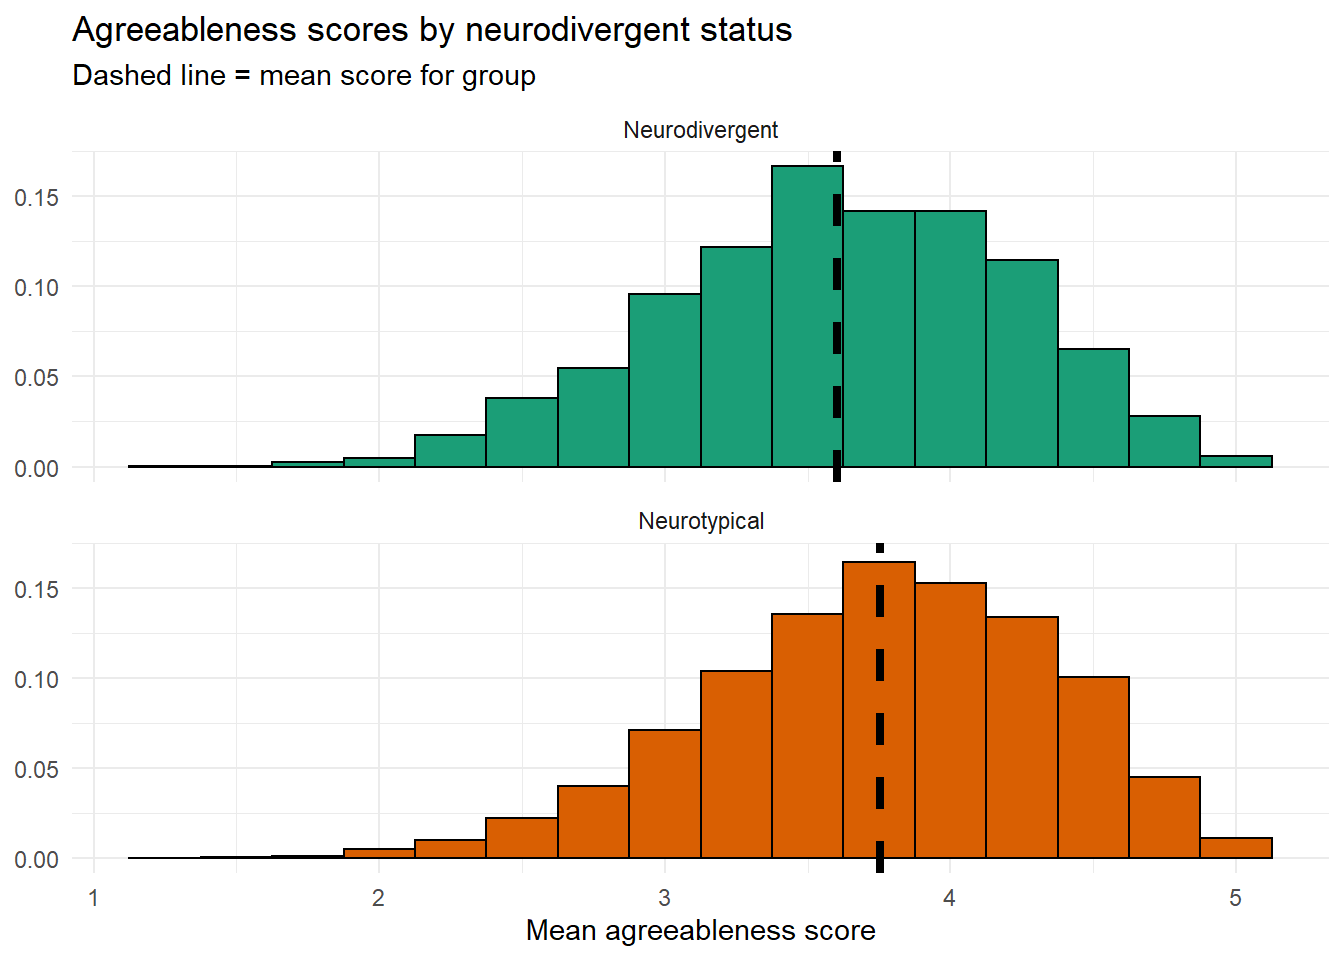
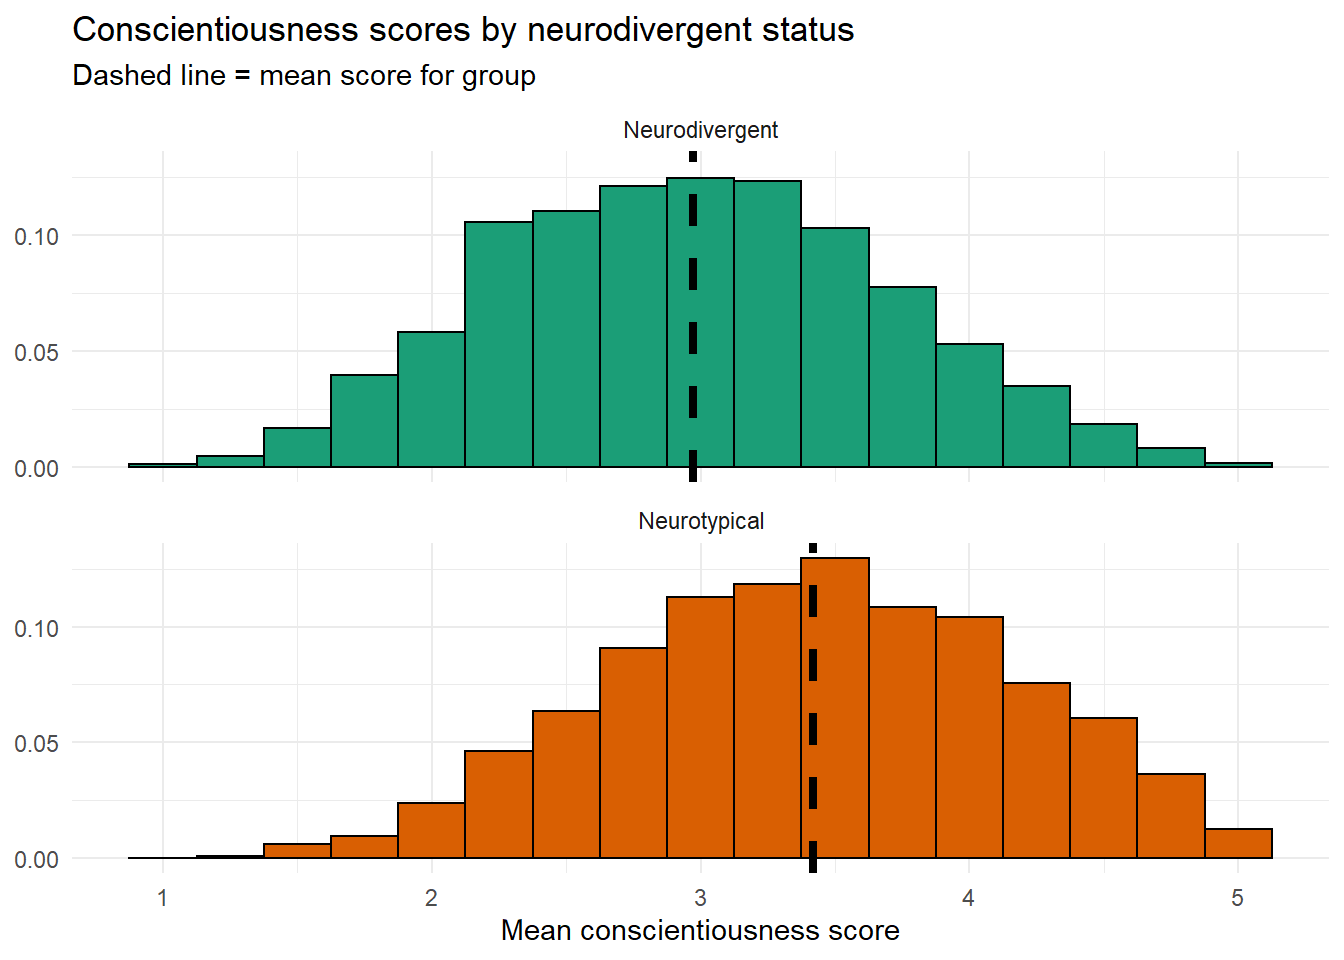
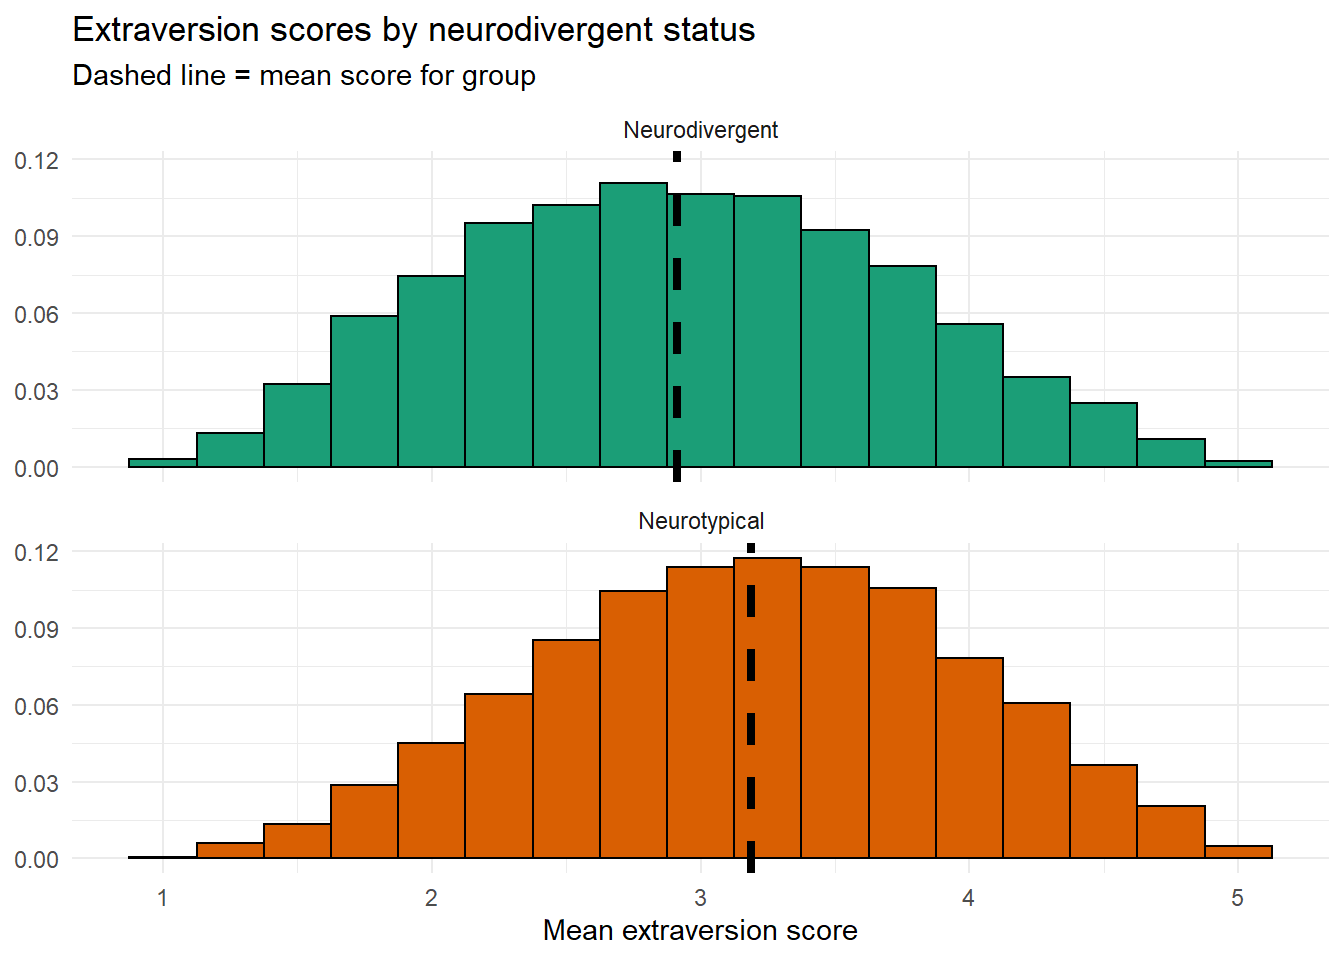
| trait | Neurodivergent | Neurotypical |
|---|---|---|
| agreeableness | 3.60 | 3.75 |
| conscientiousness | 2.97 | 3.42 |
| extraversion | 2.91 | 3.19 |
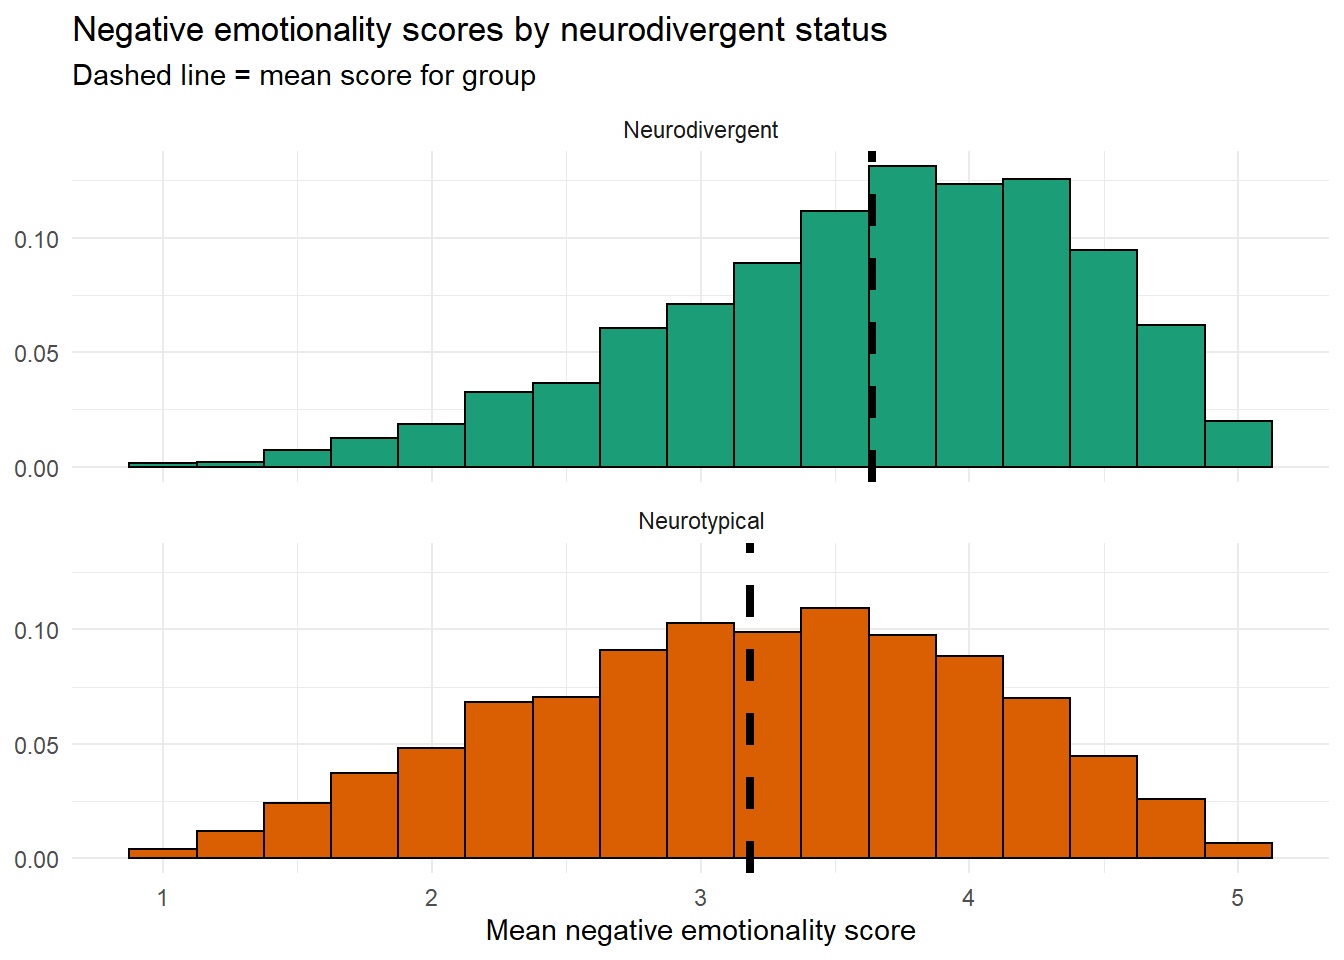
| neg_emotionality | 3.64 | 3.18 |
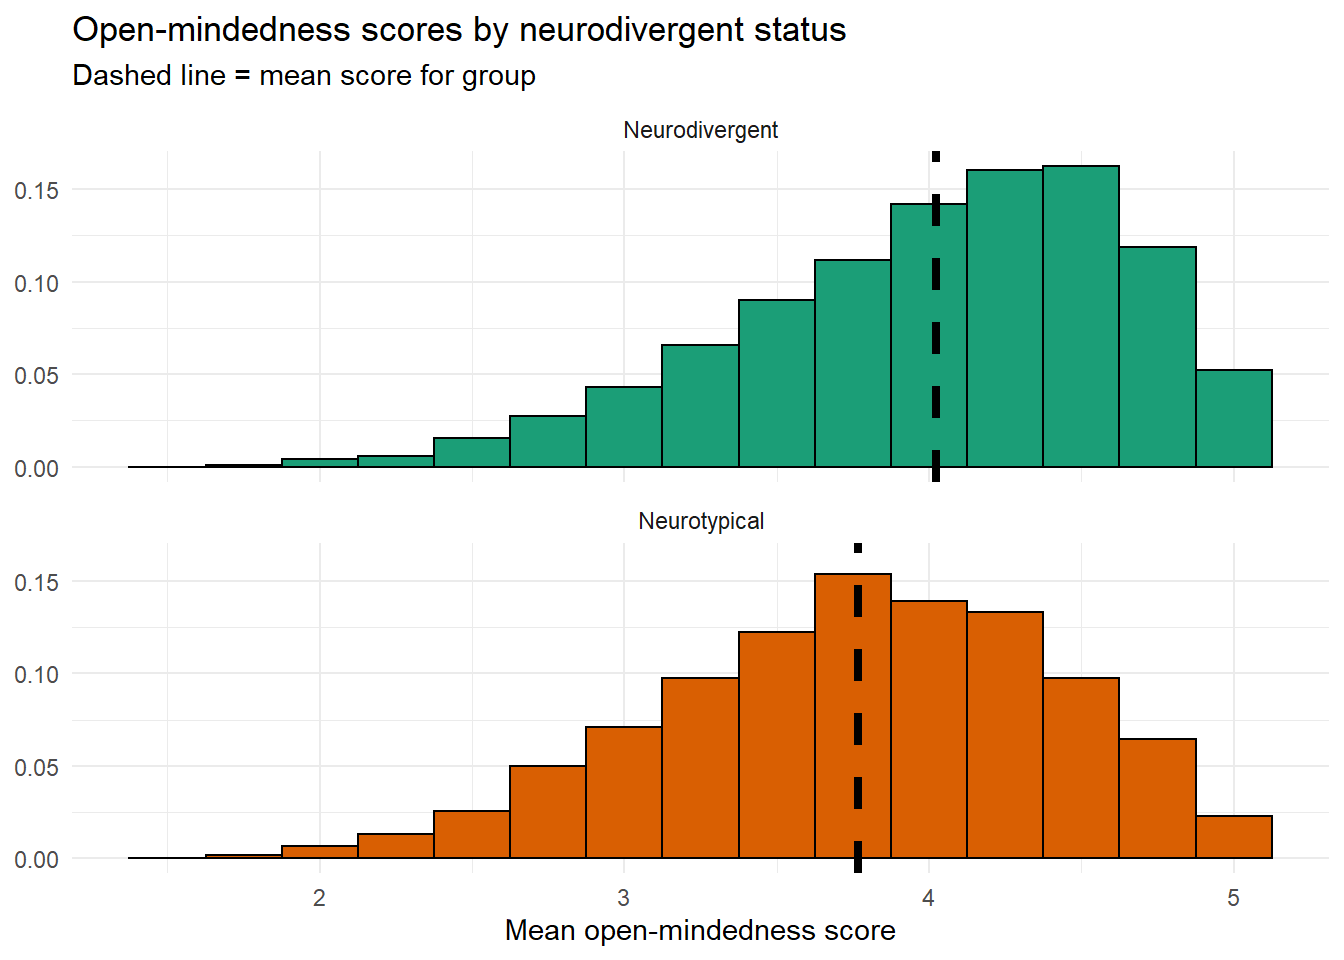
| open_minded | 4.02 | 3.77 |
Agreeableness
Mean agreeableness scores are very similar although the distribution of neurodivergent agreeableness scores is shifted to the left (i.e., lower scores).
Conscientiousness
Neurotypical participants reported higher conscientiousness scores than neurodivergent participants.
Extraversion
Neurotypical participants reported higher extraversion scores than neurodivergent participants.
Negative emotionality
Neurodivergent participants reported higher negative emotionality scores than neurotypical participants.
Open-mindedness
Neurodivergent participants reported higher open-mindedness scores than neurotypical participants.
Birth order
Participants were asked how many siblings they have and their birth order. For the purpose of this analysis, participants are categorised as only-children, first-born, middle-born, and last-born. Participants who failed to answer either or both of the sibling and birth order question were removed from this analysis.
Please note that there are a number of variables which may mediate the relationship between birth order and personality that we did not collect data on. For example, the age between siblings, whether one grew up living with one’s siblings, and whether siblings were full-siblings, half-siblings, step-siblings, or adopted siblings are all likely to impact the relationship but we do not have data on these factors.
| birth_order_recoded | n | percent |
|---|---|---|
| First-born | 3412 | 39.20 |
| Last-born | 2891 | 33.22 |
| Middle-born | 1801 | 20.69 |
| Only child | 599 | 6.88 |
All traits
| trait | Only child | First-born | Middle-born | Last-born |
|---|---|---|---|---|
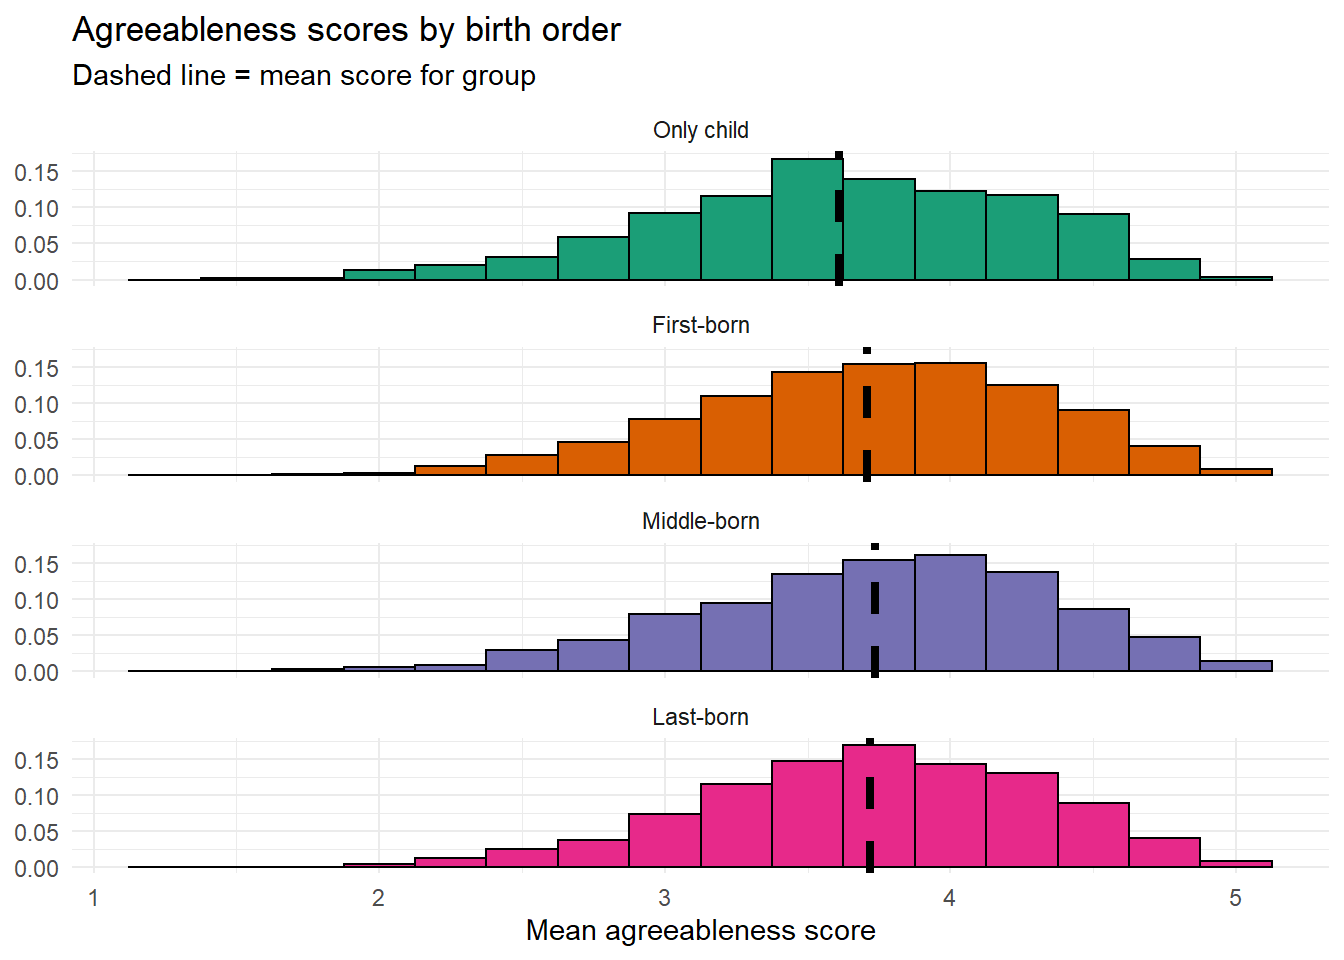
| agreeableness | 3.61 | 3.71 | 3.74 | 3.72 |
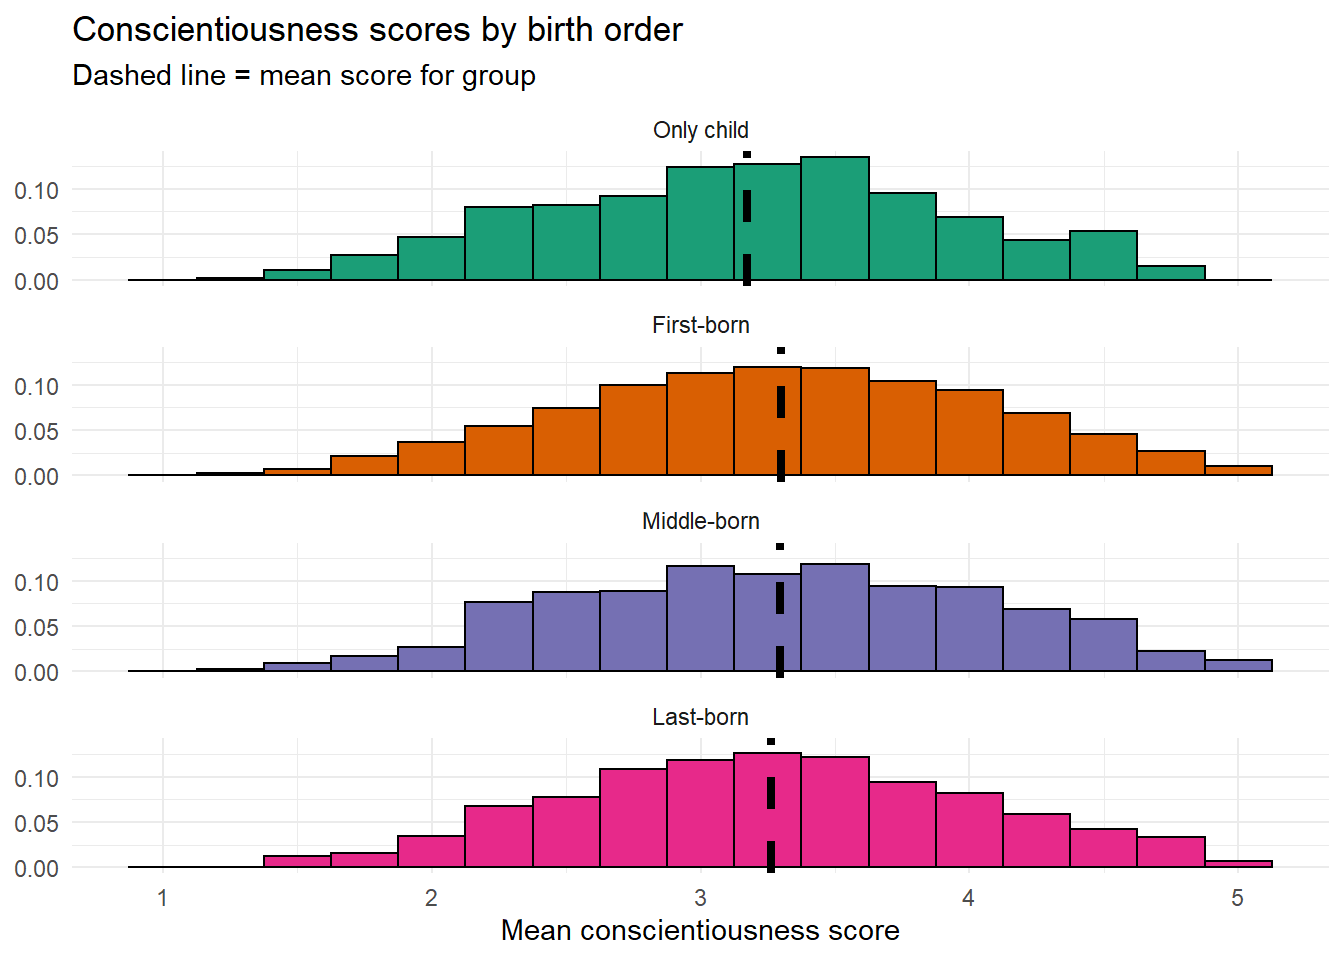
| conscientiousness | 3.17 | 3.30 | 3.30 | 3.26 |
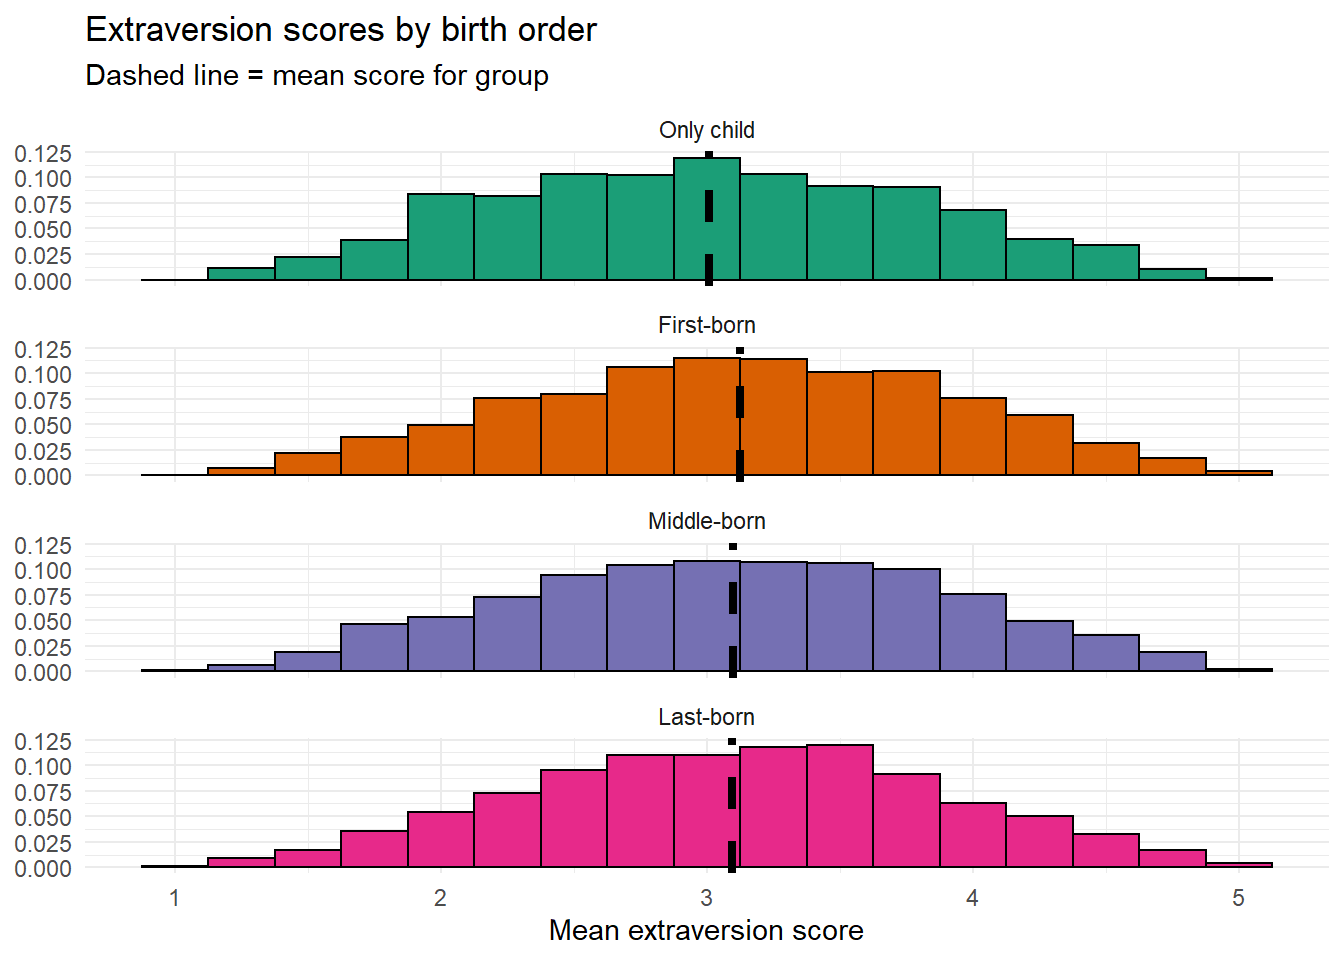
| extraversion | 3.01 | 3.12 | 3.10 | 3.10 |
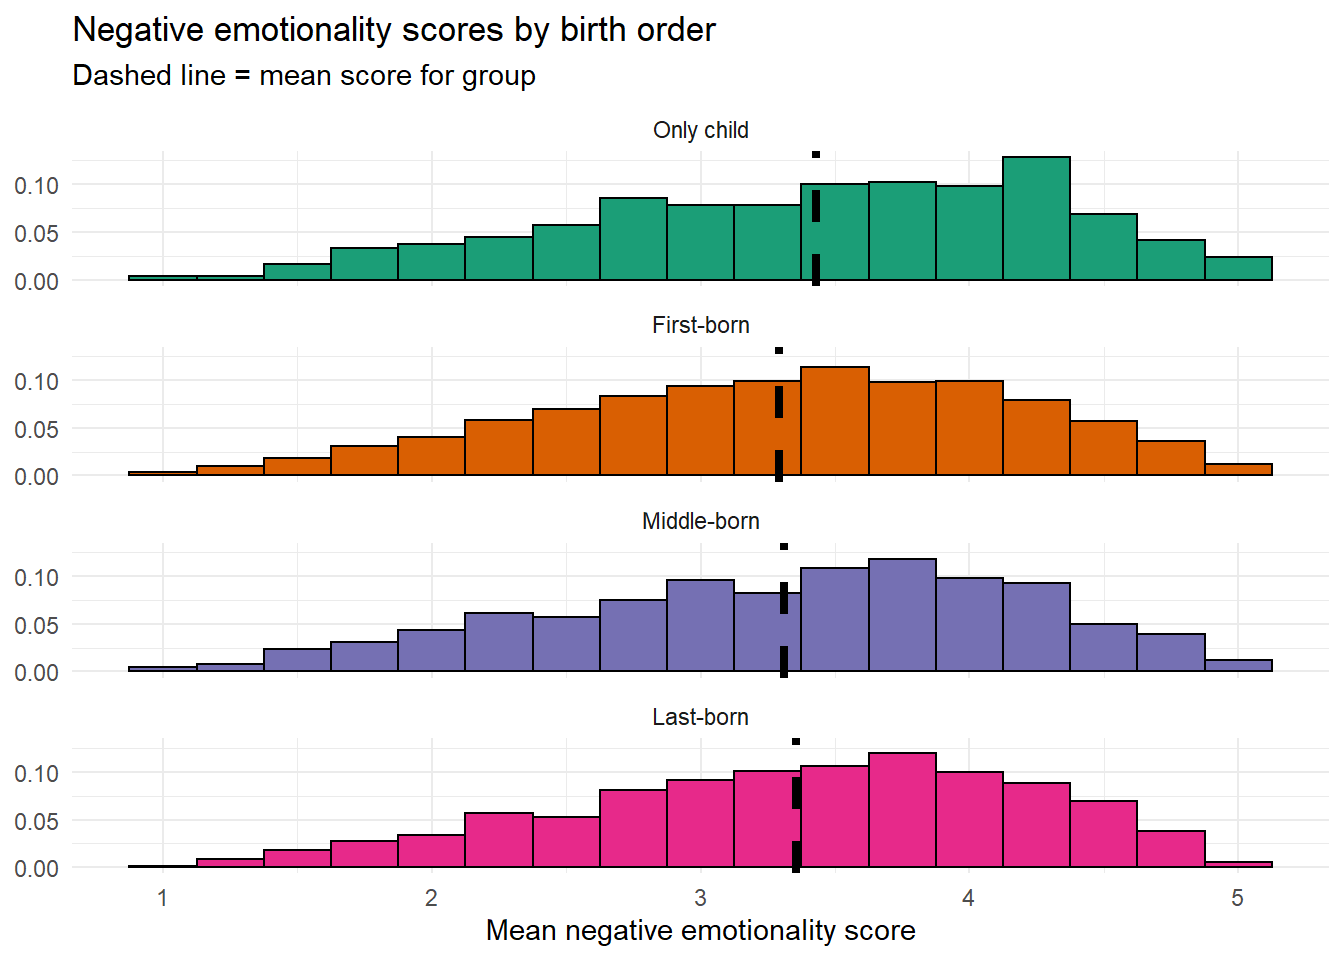
| neg_emotionality | 3.43 | 3.29 | 3.31 | 3.36 |
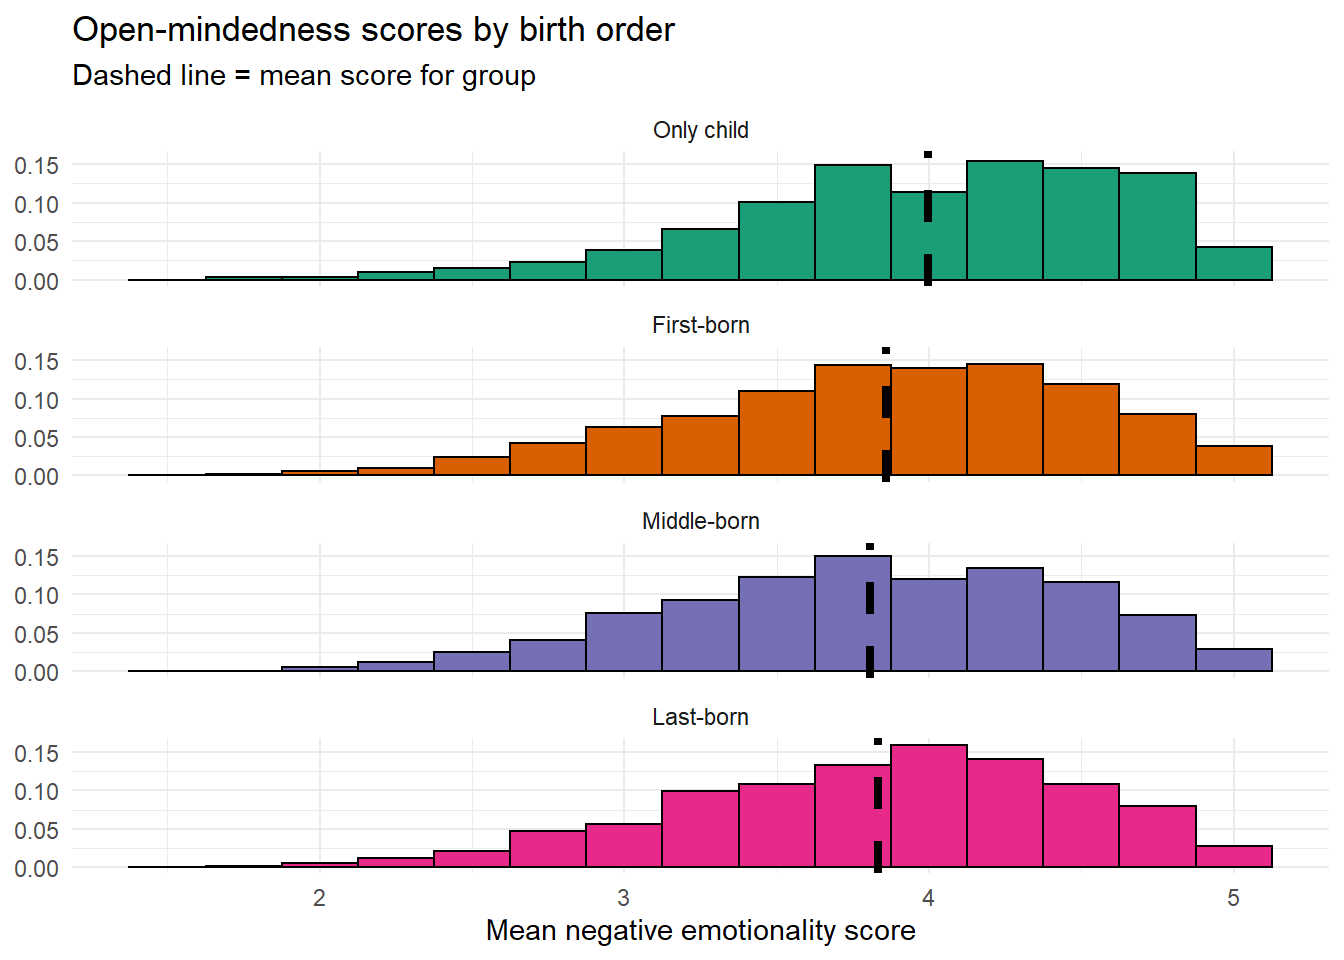
| open_minded | 4.00 | 3.86 | 3.81 | 3.83 |
Agreeableness
Only children report slightly lower agreeableness scores than those with siblings although the distributions and mean scores are all very similar.
Conscientiousness
The distributions and mean scores for conscientiousness are all very similar.
Extraversion
The distributions and mean scores for extraversion are all very similar.
Negative emotionality
Only children reported slightly higher negative emotionality than those with siblings, for whom the distributions were all very similar.
Open-mindedness
Only children reported higher open-mindedness than those with siblings, for whom the distributions were all very similar.
Conclusions
Please treat the analysis presented in this document with due caution before drawing any conclusions. Separating each demographic variable means that we cannot account for any confounds or interactions that are extremely likely to be present in the data. Combined with the lack of inferential statistical analysis, these data should be viewed as providing an exploratory descriptive view of personality and individual differences for this specific sample, rather than being generalisable to the wider population.
Emily Nordmann
Senior Lecturer in Psychology, Associate Dean of Learning and Teaching
I am a teaching-focused Senior lecturer and conduct research into the relationship between learning, student engagement, and technology.